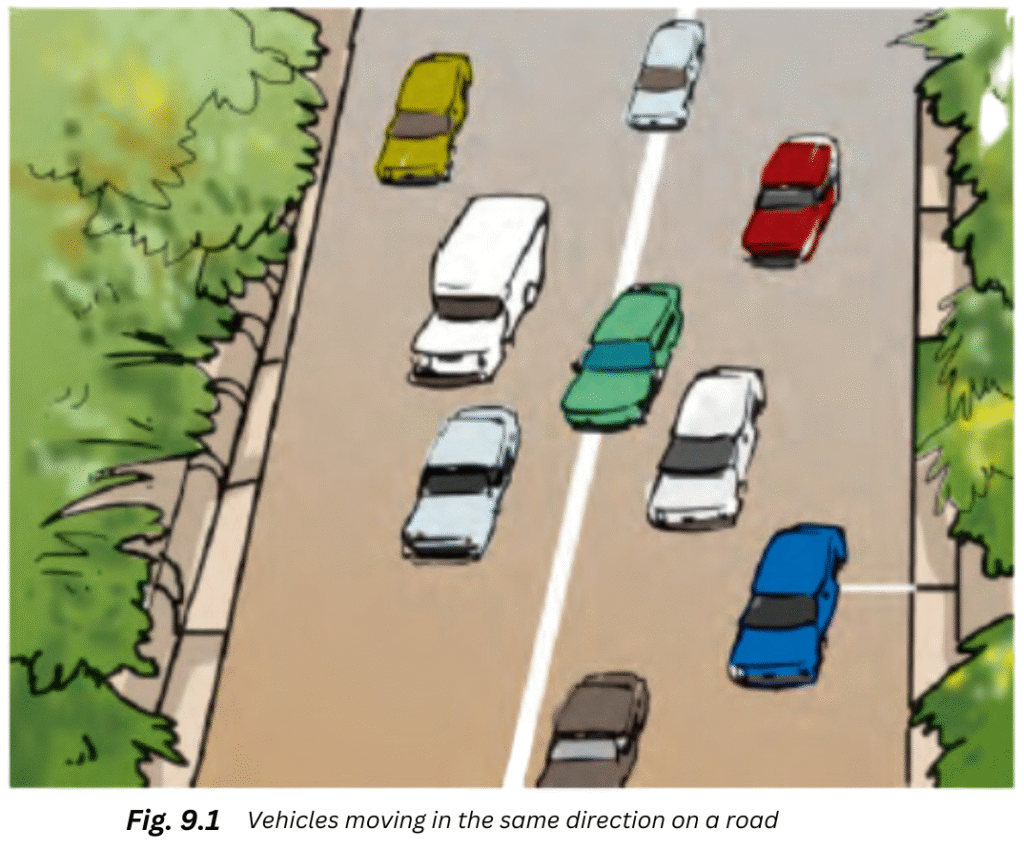
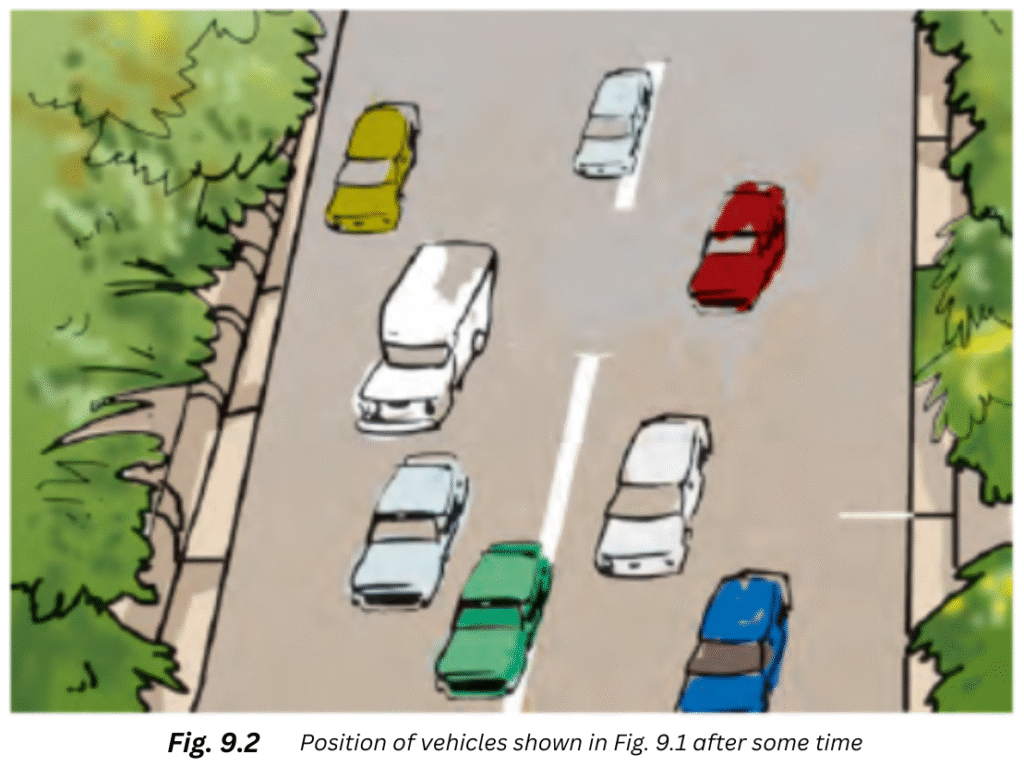
1. Complete Activity 9.1 (Page 82). Look at Fig. 9.1. It shows the position of some vehicles moving on a road in the same direction at some instant of time. Now look at Fig. 9.2. It shows the position of the same vehicles after some time. From your observation of the two figures, answer the following questions: Which vehicles is moving the fastest of all? Which one of them is moving the slowest of all?
Answer:
By observing the initial and final positions of the cars in Fig. 9.1 and Fig. 9.2 we can conclude that the green car is the fastest since it covers the greatest distance out of all the cars. The rest of the cars all seem to be moving at around the same speed.
We can verify our observations in the following way:
Aim: To find which vehicle is moving the fastest and which vehicle is moving the slowest by looking at Fig. 9.1 and Fig. 9.2.
Materials Required: Fig. 9.1 and Fig. 9.2 in NCERT Class 7 Science textbook, ruler.
Procedure:
(i) Take your ruler and place the 0 cm mark on the extreme upper end of each car. Measure the length between the extreme upper end of each car and the horizontal white line on the right in Figure 9.1 for each car.
(ii) Now repeat the process for each car in Figure 9.2.
(iii) For the cars which have not crossed the horizontal white line on the right, subtract the lengths obtained in (ii) from the lengths obtained in (i) for each car. The numbers you get will be the distances covered by the cars. For the cars which have crossed the horizontal white line, add the numbers instead of subtracting to get the distances covered by the cars.
(iv) Compare the distances to decide which vehicle is moving the fastest and which vehicle is moving the slowest.
Observations: The calculations are shown in the table below:
| Positions in Fig. 9.1 | Initial Length (Fig. 9.1) | Initial Length (Fig. 9.2) | Subtraction (car has not crossed white line) | Addition (car has crossed white line) |
| Dark green car on top left | 5.3 cm | 4 cm | 1.3 cm | |
| Blue car top centre | 5.7 cm | 4.5 cm | 1.2 cm | |
| Red car top right | 4.6 cm | 3.4 cm | 1.2 cm | |
| White truck on left | 4 cm | 2.7 cm | 1.3 cm | |
| Blue car middle left | 1.9 cm | 0.6 cm | 1.3 cm | |
| Green car in middle (fastest) | 3.1 cm | 0.3 cm | 3.4 cm | |
| White car on right | 2.2 cm | 1 cm | 1.2 cm | |
| Blue car on lower right | 0.7 cm | 0.6 cm | 1.3 cm |
Conclusions: From our calculations we can confirm that the green car in the middle is the fastest one and all the other cars seem to be moving with around the same speed.
“Look at Fig. 9.1. It shows the position of some vehicles moving on a road in the same direction at some instant of time. Now look at Fig. 9.2. It shows the position of the same vehicles after some time. From your observation of the two figures, answer the following questions: Which vehicles is moving the fastest of all? Which one of them is moving the slowest of all?” – Solved.
Related Links:
Solution to Extended Learning Problem 1
Solution to Extended Learning Problem 2
Solution to Extended Learning Problem 3
Solution to Extended Learning Problem 4
Solution to Activity 9.1
Solution to Activity 9.2
Solution to Activity 9.3