Hello guys and welcome! You will find that data handling can be fun when you get the hang of it. We are there to help you reach that stage. We have prepared excellent solutions to NCERT Class 7 Math Chapter 3 Data Handling which will help you grasp the concepts quickly. We have also included sample extra problems on the topic to give you additional practice. We only suggest that you work out the problems on your own alongside looking at the solutions, for maximum benefit.
Solutions to Exercise 3.1 (Page No 47) of NCERT Class 7 Math Chapter 3 Data Handling –
1. Find the range of heights of any ten students in your class.
Answer:
Let the recorded heights (in cm) of any 10 students in the class be as follows: 130 cm, 141 cm, 156 cm, 133.5 cm, 144.5 cm, 150 cm, 135 cm, 149 cm, 138 cm, 152 cm.
Arranging the height in ascending order we get: 130 cm, 133.5 cm, 135 cm, 138 cm, 141 cm, 144.5 cm, 149 cm, 150 cm, 152 cm, 156 cm.
Highest observation = 156 cm and lowest observation = 130 cm. Range = Highest observation – lowest observation = 156 cm – 130 cm = 26 cm.
2. Organise the following marks in a class assessment, in a tabular form.
4, 6, 7, 5, 3, 5, 4, 5, 2, 6, 2, 5, 1, 9, 6, 5, 8, 4, 6, 7
(i) Which number is the highest? (ii) Which number is the lowest?
(iii) What is the range of the data? (iv) Find the arithmetic mean.
Answer:
First, we organise the marks in ascending order: 1, 2, 2, 3, 4, 4, 4, 5, 5, 5, 5, 5, 6, 6, 6, 6, 7, 7, 8, 9.
Now, let us put them in a tabular form:

(i) We can clearly see that the highest number = 9.
(ii) It can clearly be seen that the lowest number = 1
(iii) The range of the data = Highest value – lowest value = 9 – 1 = 8.
(iv) Arithmetic mean = (Sum of all observations)/(Total number of observations)
Sum of all observations = 1 + 2 + 2 + 3 + 4 + 4 + 4 + 5 + 5 + 5 + 5 + 5 + 6 + 6 + 6 + 6 + 7 + 7 + 8 + 9 = 100
Total number of observations = 20
Therefore, the Arithmetic mean = 100/20 = 5
3. Find the mean of the first five whole numbers.
Answer:
The first five whole numbers are 0, 1, 2, 3, 4.
Arithmetic mean = (Sum of first five whole numbers)/(Total number of whole numbers) = (0 + 1 + 2 + 3 + 4)/5 = 10/5 = 2
4. A cricketer scores the following runs in eight innings:
58, 76, 40, 35, 46, 45, 0, 100.
Find the mean score.
Answer:
Total number of runs he scored in eight innings = 58 + 76 + 40 + 35 + 46 + 45 + 0 + 100 = 400
Total number of innings he played = 8
Therefore, Arithmetic mean = (Total number of runs he scored )/(Total number of innings he played ) = 400/8 = 50
5. Following table shows the points each player scored in four games:
| Player | Game 1 | Game 2 | Game 3 | Game 4 |
| A | 14 | 16 | 10 | 10 |
| B | 0 | 8 | 6 | 4 |
| C | 8 | 11 | Did not Play | 13 |
Now, answer the following questions:
(i) Find the mean to determine A’s average number of points scored per game.
(ii) To find the mean number of points per game for C, would you divide the total points by 3 or by 4? Why?
(iii) B played in all four games. How would you find the mean?(iv) Who is the best performer?
Answer:
(i) A’s average number of points scored per game = (Total number of points A scored in 4 games )/(Total number of games) = (14 + 16 +10 +10 )/4 = 50/4 = 12.5
(ii) We divide the total points by 3 because it is tabulated that C played only 3 games (did not play Game 3).
(iii) Mean of B’s scores = (Total number of points B scored in 4 games )/(Total number of games) = (0 + 8 + 6 + 4 )/4 = 18/4 = 4.5 points.
(iv) We already know the mean points scored by A and B. Let us find the mean points scored by C.
Mean of C’s scores = (Total number of points C scored in 3 games )/(Total number of games) = (8 + 11 + 13)/4 = 32/3 = 10.67 points.
We observe, that the mean of A’s scores = 12.5 is the greatest among the 3 players. Therefore, A is the best performer.
6. The marks (out of 100) obtained by a group of students in a science test are 85, 76,
90, 85, 39, 48, 56, 95, 81 and 75. Find the:
(i) Highest and lowest marks obtained by the students.
(ii) Range of the marks obtained.
(iii) Mean marks obtained by the group.
Answer:
(i) First, we arrange the marks obtained in ascending order: 39, 48, 56, 75, 76, 81, 85, 85, 90, 95.
Therefore, highest marks obtained = 95 and lowest marks obtained = 39.
(ii) Range of the marks obtained = Highest marks – Lowest marks = 95 – 39 = 56.
(iii) Mean marks obtained = (Sum of the marks obtained by the students )/(Number of students)
Sum of the marks obtained by the students = 39 + 48 + 56 + 75 + 76 + 81 + 85 + 85 + 90 + 95 = 730.
The number of students = 10. Therefore, the mean marks obtained by the group = 730/10 = 73.
7. The enrolment in a school for six consecutive years was as follows:
1555, 1670, 1750, 2013, 2540, 2820.
Find the mean enrolment of the school for this period.
Answer:
Mean enrolment = (Total enrolment over six years)/(Total number of years) = (1555 + 1670 + 1750 + 2013 + 2540 + 2820 )/6 = 12348/6 = 2058.
8. The rainfall (in mm) in a city on 7 days of a certain week was recorded as follows:
| Day | Mon | Tue | Wed | Thurs | Fri | Sat | Sun |
| Rainfall (in mm) | 0.0 | 12.2 | 2.1 | 0.0 | 20.5 | 5.5 | 1.0 |
(i) Find the range of rainfall in the above data.
(ii) Find the mean rainfall for the week.
(iii) On how many days was the rainfall less than the mean rainfall?
Answer:
(i) From the above data, the highest rainfall = 20.5 mm and the lowest rainfall = 0.0 mm.
Therefore, range = Highest rainfall – lowest rainfall = 20.5 mm – 0.0 mm = 20.5 mm.
(ii) The mean rainfall for the week = (Total amount of rainfall over 7 days)/(Total number of days) = (0.0 + 12.2 + 2.1 + 0.0 + 20.5 + 5.5 + 1.0)/7 = 41.3/7 = 5.9 mm.
(iii) The rainfall was less than the mean rainfall (=5.9 mm) on these 5 days: Monday, Wednesday, Thursday, Saturday, Sunday.
9. The heights of 10 girls were measured in cm and the results are as follows:
135, 150, 139, 128, 151, 132, 146, 149, 143, 141.
(i) What is the height of the tallest girl?
(ii) What is the height of the shortest girl?
(iii) What is the range of the data?
(iv) What is the mean height of the girls?
(v) How many girls have heights more than the mean height?
Answer:
The heights (in cm) arranged in ascending order are as follows: 128, 132, 135, 139, 141, 143, 146, 149, 150, 151.
(i) We observe that the height of the tallest girl = 151 cm.
(ii) We observe that the height of the shortest girl = 128 cm.
(iii) Range = Highest value – lowest value = 151 cm – 128 cm = 23 cm.
(iv) Mean height = (Sum of all heights )/(Total number of students) = (128 + 132 + 135 + 139 + 141 + 143 + 146 + 149 + 150 + 151 )/10 = 1414/10 = 141.1 cm.
(v) Therefore, we observe the number of girls that have heights more than the mean height = 5.
Solutions to Exercise 3.2 (Page No 52) of NCERT Class 7 Math Chapter 3 Data Handling –
1. The scores on the mathematics test (out of 25) of 15 students are as follows:
19, 25, 23, 20, 9, 20, 15, 10, 5, 16, 25, 20, 24, 12, 20
Find the mode and median of this data. Are they the same?
Answer:
First, we arrange the scores in ascending order: 5, 9, 10, 12, 15, 16, 19, 20, 20, 20, 20, 23, 24, 25, 25.
The mode is the observation that occurs the most often. Therefore, in the above set of observations the mode = 20.
The median is the middle observation when the data is arranged in ascending (or descending order).
There are 15 scores given to us. Therefore, in the above set of observations the median is the middle value = (15 + 1)/2 = 8th value = 20. Yes, both the mode and median are the same = 20.
2. The runs scored in a cricket match by 11 players as follows:
6, 15, 120, 50, 100, 80, 10, 15, 8, 10, 15
Find the mean, mode and median of this data. Are the three same?
Answer:
First, we arrange the scores in ascending order: 6, 8, 10, 10, 15, 15, 15, 50, 80, 100, 120
Mean runs scored = (Sum of runs scores by all players)/(Total number of players) = (6 + 8 + 10 + 10 + 15 + 15 + 15 + 50 + 80 + 100 + 120)/11 = 429/11 = 39
The mode is the observation that occurs the most often. Therefore, in the above set of observations the mode = 15.
The median is the middle observation when the data is arranged in ascending (or descending order).
Therefore, in the above set of observations the median is the middle value, that is the 6th value = 15. No, the three are not the same.
3. The weights (in kg.) of 15 students of a class are:
38, 42, 35, 37, 45, 50, 32, 43, 43, 40, 36, 38, 43, 38, 47
(i) Find the mode and median of this data.
(ii) Is there more than one mode?
Answer:
First, we arrange the scores in ascending order: 32, 35, 36, 37, 38, 38, 38, 40, 42, 43, 43, 43, 45, 47, 50
(i) The mode is the observation that occurs the most often. Therefore, in the above set of observations the mode = 38 and 43 (both occur three times).
The median is the middle observation when the data is arranged in ascending (or descending order).
Therefore, in the above set of observations the median is the middle value, that is the 8th value = 40.
(ii) Yes, there are two modes: 38 and 43.
4. Find the mode and median of the data: 13, 16, 12, 14, 19, 12, 14, 13, 14.
Answer:
First, we arrange the scores in ascending order: 12, 12, 13, 13, 14, 14, 14, 16, 19.
The mode is the observation that occurs the most often. Therefore, in the above set of observations the mode = 14.
The median is the middle observation when the data is arranged in ascending (or descending order). Therefore, in the above set of observations the median is the middle value = (9 + 1)/2 = 5th value = 14.
5. Tell whether the statement is true or false.
(i) The mode is always one of the numbers in a data.
Answer: True. The mode is the observation that occurs the most often. Therefore, there will always be a mode in a given set of data.
(ii) The mean is one of the numbers in the data.
Answer: False. By definition, the mean = (Sum of all observations)/(Number of observations). Therefore, the mean may not necessarily be = one of the numbers in the data. It can indeed be a different value.
(iii) The median is always one of the numbers in a data.
Answer: True. The median is the middle observation when the data is arranged in ascending (or descending order). Hence, the median will always have to be one of the numbers in a data.
(iv) The data 6, 4, 3, 8, 9, 12, 13, and 9 have the mean 9.
Answer: False. By definition, the mean = (Sum of all observations)/(Number of observations) = (6 + 4 + 3 + 8 + 9 + 12 + 13 + 9)/9 = 64/8 = 8.
Solutions to Exercise 3.3 (Page No 57) of NCERT Class 7 Math Chapter 3 Data Handling –
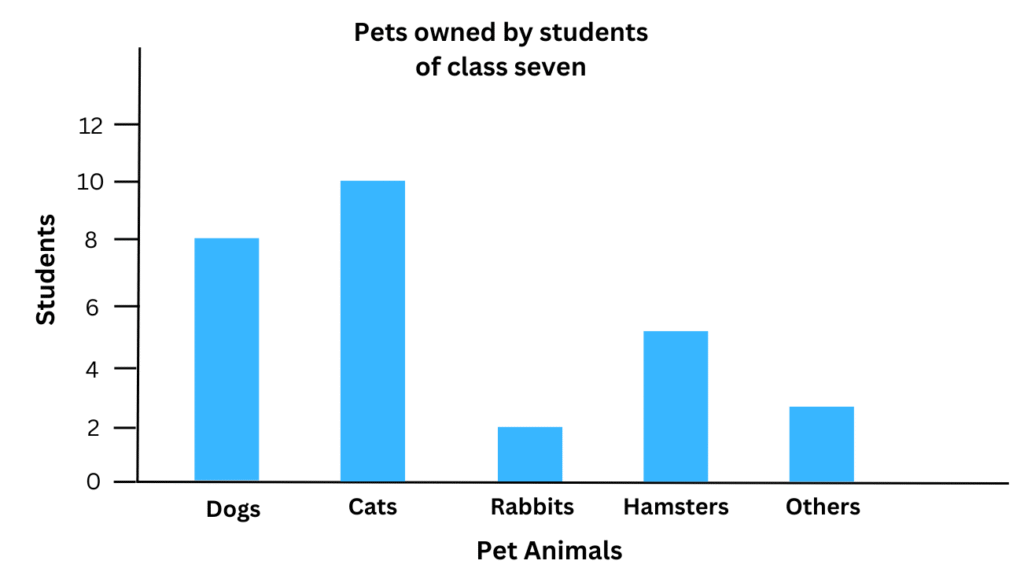
1. Use the bar graph (Fig 3.3) to answer the following questions.
(a) Which is the most popular pet?
(b) How many students have dogs as a pet?
Answer:
Answer:
(a) We observe, the most popular pet is the cat (as it is owned by the greatest number of students).
(b) From the graph we observe that 8 students have dogs as pets.
2. Read the bar graph (Fig 3.4), which shows the number of books sold by a bookstore during five consecutive years, and answer the following questions.
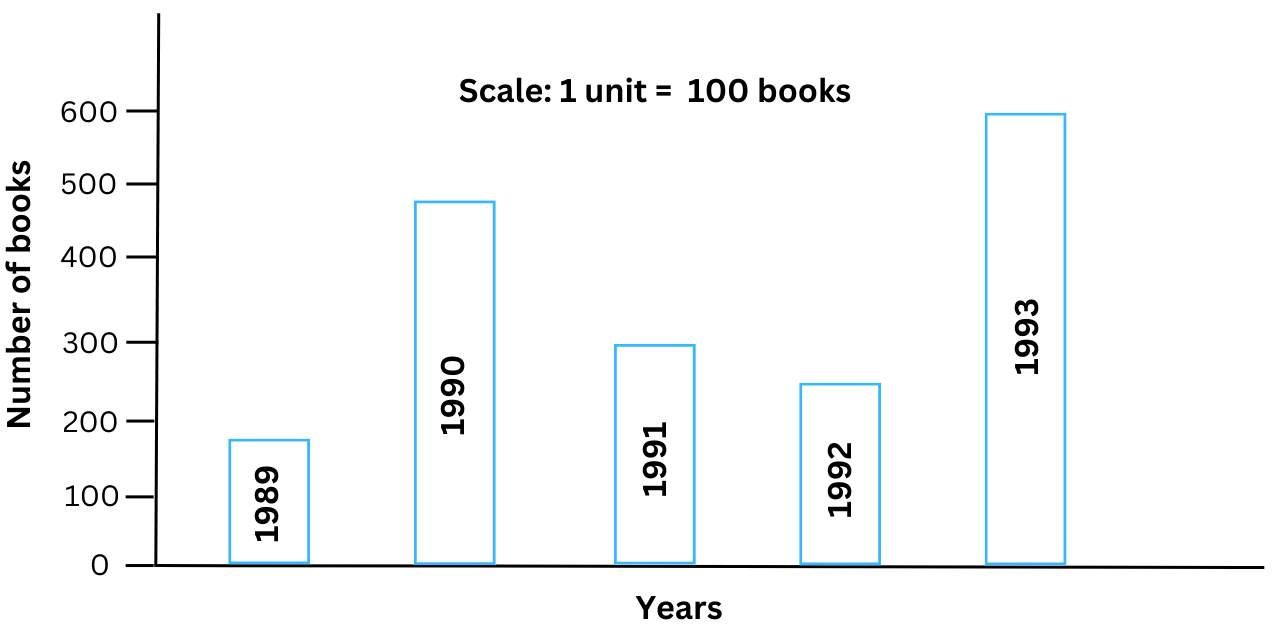
(i) About how many books were sold in 1989? 1990? 1992?
(ii) In which year were about 475 books sold? About 225 books sold?
(iii) In which years were fewer than 250 books sold?
(iv) Can you explain how you would estimate the number of books sold in 1989?
Answer:
(i) We estimate from the bar graph that the number of books sold in 1989 = 180 books, the number of books sold in 1990 = 480 books and the number of books sold in 1992 = 225 books.
(ii) We estimate from the bar graph, that 475 books were sold in the year 1990. Also, we estimate from the bar graph, that 225 books were sold in the year 1992.
(iii) We observe from the bar graph, fewer than 250 books sold in the year 1989.
(iv) The scale of the bar graph is: 1 unit = 100 books.
We observe that the top of the bar graph is slightly below the second unit mark. Since 2 units = 200 books, we estimate that the number of books sold in 1989 is around 180.
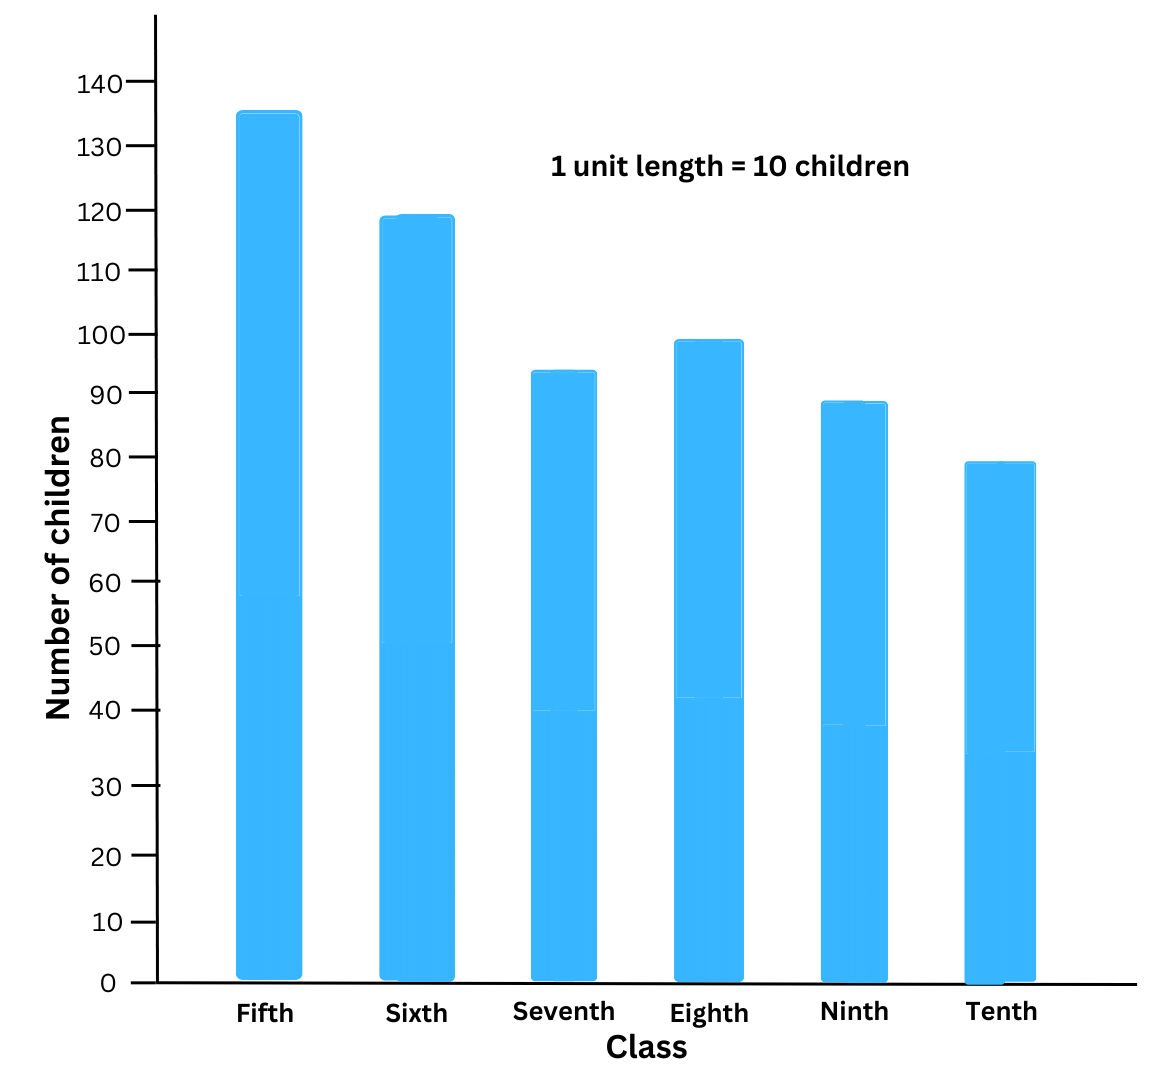
3. Number of children in six different classes is given below. Represent the data on a bar graph.
| Class | Fifth | Sixth | Seventh | Eighth | Ninth | Tenth |
| Number of Children | 135 | 120 | 95 | 100 | 90 | 80 |
(a) How would you choose a scale?
(b) Answer the following questions:
(i) Which class has the maximum number of children? And the minimum?
(ii) Find the ratio of students of Class six to the students of Class eight.
Answer:
The data is represented in the bar graph as shown below:
(a) We choose the scale as follows:
- Start the scale at 0.
- The greatest value in the data is 135, so we end the scale at a value greater than 135 such as 140.
- Use equal divisions along the axes.
- Choose the appropriate number of divisions – not too many and not too few. Too many divisions will prove to be redundant (you won’t need so many divisions to accurately estimate the values). At the same time, too few divisions will make it hard for you to estimate the values for the different bar graphs.
- Therefore, we use our judgement and the choose the scale as: 1 unit division (or length) = 10 children.
(b) (i) We observe from the bar graph, that the class that has the maximum number of children (= 135 children) is Class Fifth.
We also observe from the bar graph, that the class that has the minimum number of children (= 80 children) is Class Tenth.
(ii) Numberof students of Class Sixth = 120.
Number of students of Class Eighth = 100.
Therefore, the ratio of students of Class six to the students of Class eight = = (Number of students of Class Sixth)/(Number of students of Class Eighth ) = 120/100 = (120 ÷ 20)/(100 ÷ 20) = 6/5 = 6 : 5
4. The performance of a student in the 1st Term and 2nd Term is given. Draw a double bar graph choosing appropriate scale and answer the following:
| Subject | English | Hindi | Maths | Science | S. Science |
| 1st Term (M.M. 100) | 67 | 72 | 88 | 81 | 73 |
| 2nd Term (M.M. 100) | 70 | 65 | 95 | 85 | 75 |
(i) In which subject, has the child improved his performance the most?
(ii) In which subject is the improvement the least?
(iii) Has the performance gone down in any subject?
Answer:
The double bar graph for the data with the appropriate scale of 1 unit length = 10 marks is shown below:
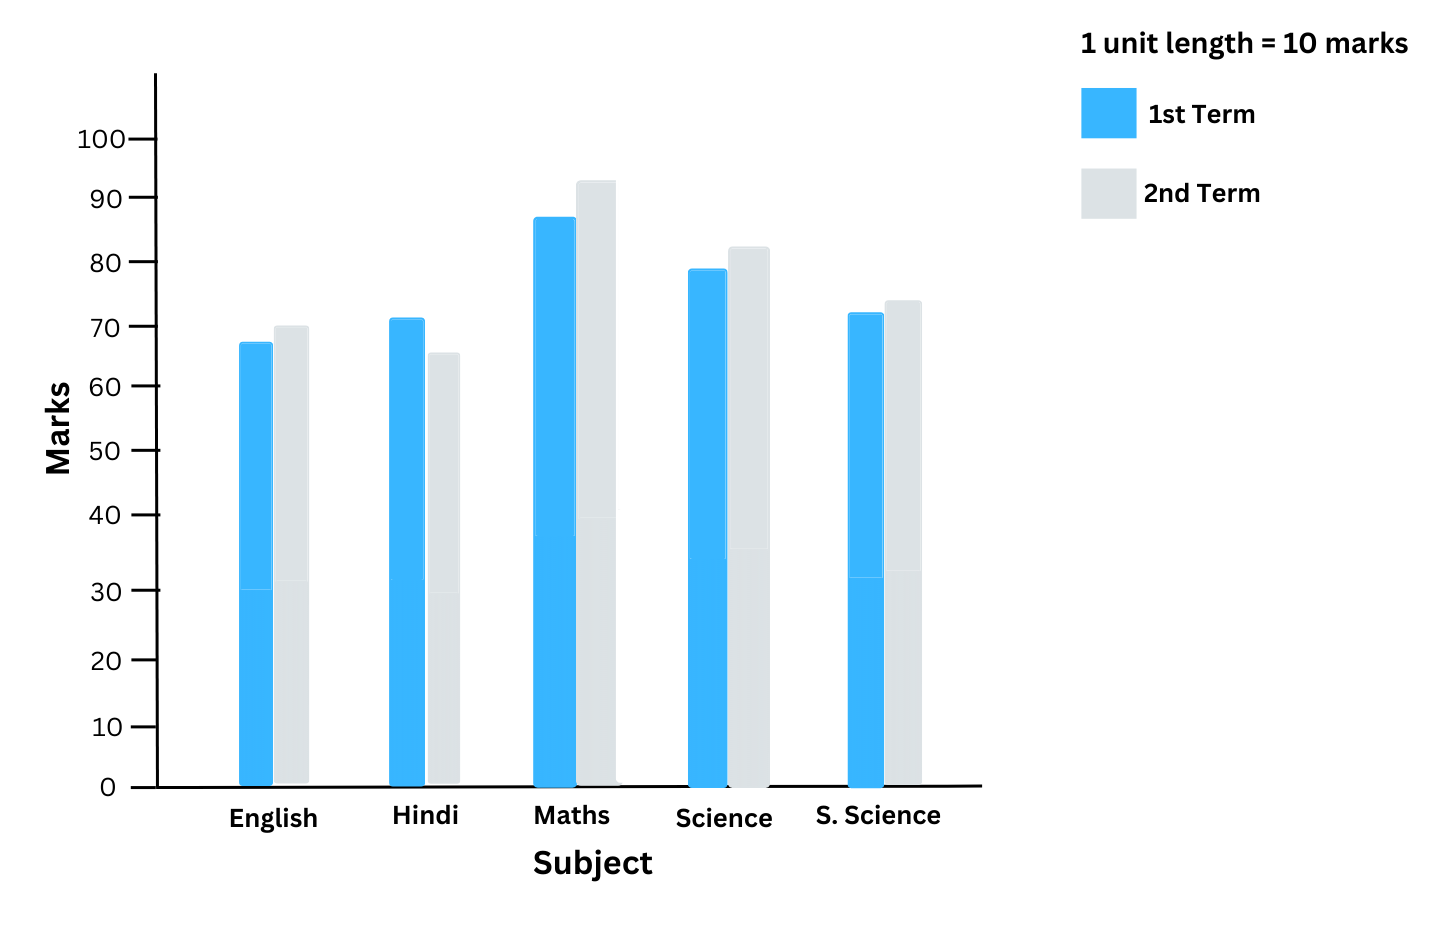
(i) From the double bar graph, we observe that the maximum increase in marks is in Maths (the difference in height between the two adjacent bars is the greatest for Maths). So, we conclude that the child improved his performance the most in Maths.
(ii) From the double bar graph, we observe that the minimum increase in marks is in S. Science (the difference in height between the two adjacent bars is the least for S. Science). So, we conclude that the child improved the least in S. Science.
(iii) We observe that for Hindi the height of bar for the 2nd Term is less than the height for the 1st Term. Therefore, we conclude that the performance has gone down in Hindi.
5. Consider this data collected from a survey of a colony.
| Favourite Sport | Cricket | Basket Ball | Swimming | Hockey | Athletics |
| Watching | 1240 | 470 | 510 | 430 | 250 |
| Participating | 620 | 320 | 320 | 250 | 105 |
(i) Draw a double bar graph choosing an appropriate scale.
What do you infer from the bar graph?
(ii) Which sport is most popular?
(iii) Which is more preferred, watching or participating in sports?
Answer:
(i) The double bar graph with the appropriate scale of 1 unit length = 100 people is shown below:
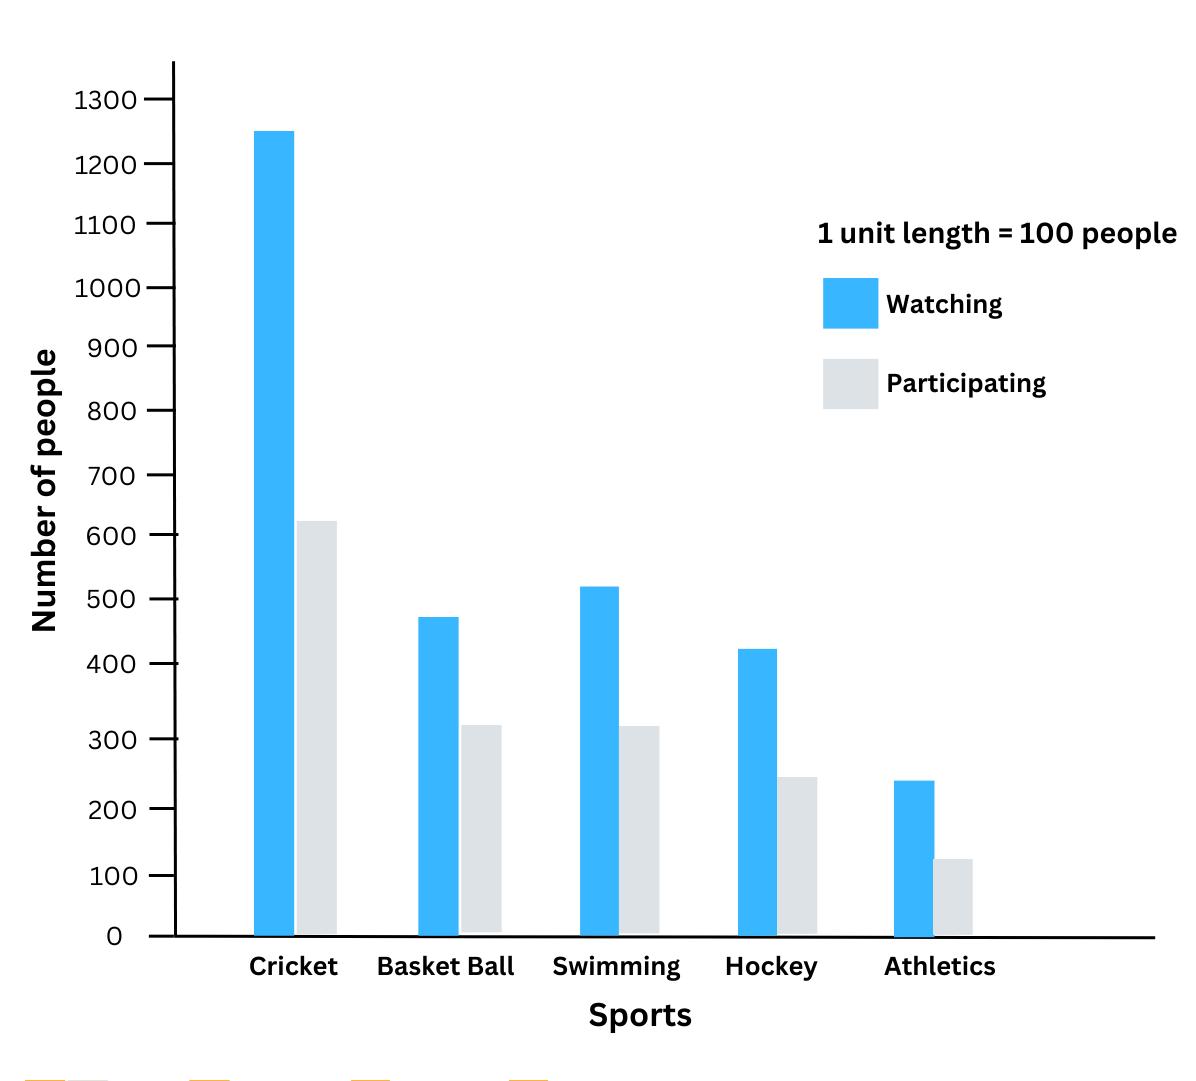
We infer from the double bar graph, that cricket and swimming are the most popular sports for watching and participating are cricket and swimming and the least popular sports for watching and participating is athletics.
(ii) We observe that the bars for both watching and participating are the highest in cricket. Therefore, we conclude that cricket is the most popular sport.
(iii) We observe from the double bar graph that for every sport, the bar for watching is higher than the bar for participating. Therefore, we conclude that watching is more preferred.
6. Take the data giving the minimum and the maximum temperature of various cities given in the beginning of this Chapter (Table 3.1). Plot a double bar graph using the data and answer the following:
(i) Which city has the largest difference in the minimum and maximum temperature on the given date?
(ii) Which is the hottest city and which is the coldest city?
(iii) Name two cities where the maximum temperature of one was less than the minimum temperature of the other.
(iv) Name the city which has the least difference between its minimum and the maximum temperature.
Answer:
The data in Table 3.1 is shown below:
| Temperatures of Cities as on 20.6.2006 | ||
| City | Max. | Min. |
| Ahmedabad | 380 C | 290 C |
| Amritsar | 370 C | 260 C |
| Bangalore | 280 C | 210 C |
| Chennai | 360 C | 270 C |
| Delhi | 380 C | 280 C |
| Jaipur | 390 C | 290 C |
| Jammu | 410 C | 260 C |
| Mumbai | 320 C | 270 C |
We plot the double bar graph choosing the scale as 1 unit length = 5 degrees:
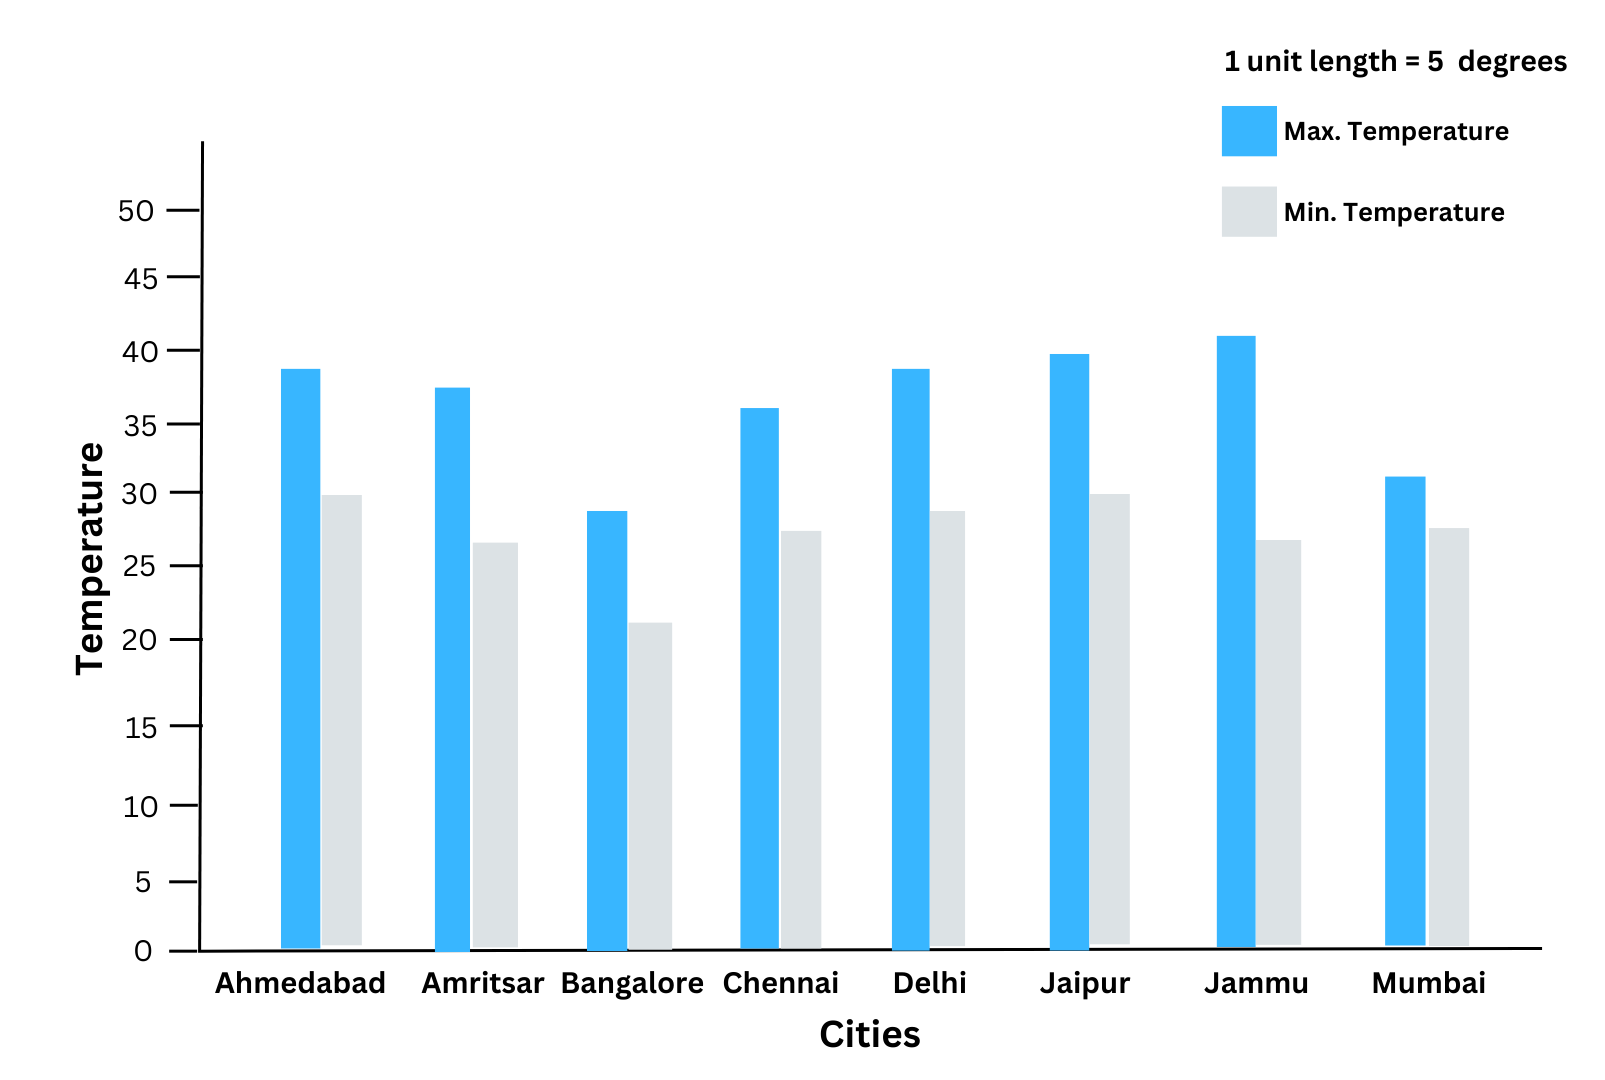
(i) From the double bar graph, we observe that the largest difference in the minimum and maximum temperature is for Jammu (the difference in height between the two adjacent bars is the greatest for Jammu).
(ii) From the bar graph, we observe that the bar for the maximum temperature is highest for Jammu. Therefore, we conclude that Jammu is the hottest city.
Also, from the bar graph, we observe that the bar for the minimum temperature is the lowest for Bangalore. Therefore, we conclude that Bangalore is the coldest city.
(iii) One pair is: Bangalore and Jaipur. For Bangalore, the maximum temperature = 280 C and minimum temperature for Jaipur = 290 C.
We give you another pair: Bangalore and Ahmedabad. In Bangalore, the maximum temperature = 280 C and minimum temperature for Ahmedabad = 290 C.
(iv) From the double bar graph, the difference in height between the two adjacent bars is the least for Mumbai. Therefore, Mumbai has the least difference between its minimum and the maximum temperatures.
Important Questions from Previous NCERT Textbook:
Exercise 3.4 Page No: 76 (Old Textbook):
1. Tell whether the following is certain to happen, impossible, can happen but not certain.
(i) You are older today than yesterday.
Answer: This is certain to happen.
(ii) A tossed coin will land heads up.
Answer: A tossed coin can land either heads up or tails up. Therefore, the above statement can happen but is not certain.
(iii) A die, when tossed, shall land up with 8 on top.
Answer: A die’s faces contain only the numbers 1, 2, 3, 4, 5, 6. The number 8 is not included. Therefore, the above is impossible.
(iv) The next traffic light seen will be green.
Answer: The next traffic light seen can be green, red or yellow. Therefore, the above statement can happen but is not certain.
(v) Tomorrow will be a cloudy day.
Answer: There is no certainty that tomorrow will be a cloudy day, it might be sunny too. Therefore, the above statement can happen but is not certain.
2. There are 6 marbles in a box with numbers from 1 to 6 marked on each of them.
(i) What is the probability of drawing a marble with the number 2?
Answer:
The possibility of drawing any of the 6 marbles marked with numbers 1, 2, 3, 4, 5, 6 is equal. So, there are 6 equally likely possible outcomes. Therefore, the probability of drawing a marble with the number 2 = 1/6.
(ii) What is the probability of drawing a marble with the number 5?
Answer:
The possibility of drawing any of the 6 marbles marked with numbers 1, 2, 3, 4, 5, 6 is equal. So, there are 6 equally likely possible outcomes. Therefore, the probability of drawing a marble with the number 5 will also be = 1/6.
3. A coin is flipped to decide which team starts the game. What is the probability that your team will start?
Answer:
When a coin is flipped there are two possible outcomes: Head or Tail. Both outcomes are equally likely. So, the probability of getting Head or Tail is equal and is = 1/2.
Therefore, if Heads is the winner, the probability that your team will make the right call and win the toss = 1/2.
Similarly, if Tails is the winner, the probability that your team will make the right call and win the toss = 1/2.
Extra Questions to Complement Solutions to NCERT Class 7 Mathematics Chapter 3 Data Handling:
Very Short Answer Type Questions:
1. There are two numbers 12 and 16 and the mean is found to be 11. State whether this is correct without calculating the mean.
Answer:
No, it is incorrect. The mean should lie between the two numbers.
2. How many fractions can we find between two fractions?
Answer:
We can find an infinite number of fractions between two fractions.
3. The mean and the median of a set of observations is the same. True/False?
Answer:
False. The mean and median of a set of observations is not necessarily the same.
4. In a set of observations 2 occurs three times, 3 occurs four times, 5 occurs four times and 6 occurs two times. What is the mode of the given data set?
Answer:
In this given data set 3 and 5 both occur the highest number of times, that is four times. Therefore, both 3 and 5 are the modes of the given data set.
5. The mean, median and mode are always one of the numbers in the data set. Is this statement correct?
Answer:
This statement is wrong. The median and mode are always one of the numbers in the data. The mean is not necessarily one of the numbers in the data.
6. You are given two data sets. One data set gives us the average number of marks obtained by boys in all subjects in an exam and the other data set gives us the average number of marks obtained by girls in all subjects in that exam. How would you compare the average marks obtained by boys and girls in each subject?
Answer:
You can draw a double bar graph for this purpose.
7. Look at the following data set:
| Year | 2015 | 2016 | 2017 | 2018 |
| Number of cars | 1000 | 1500 | 2300 | 3300 |
What suitable scale should you use to represent the data in a bar graph?
Answer: The suitable scale can be 1 unit = 1000 cars.
8. If the bars in a bar graph represent frequency, what does the highest bar represent?
Answer:
The highest bar represents the mode.
9. The highest value in a data set is 60 and the range is 31. What is the lowest value?
Answer:
Range = Highest value – lowest value. Therefore, lowest value = Highest value – Range = 60 – 31 = 29.
10. If no number repeats in a set of data, what can you say about the mode?
Answer:
We say for the given set of data that there is no mode.
Multiple Choice Questions (MCQ):
1. The test scores of a class of 30 students are recorded. The mean score is 75. What is the total score of the class?
(a) 2250
(b) 2200
(c) 75
(d) Cannot be obtained
Answer: (a) 2250
Mean score = (Total Score)/(Number of students)
or, 75 = (Total Score)/30
or, Total score = 75 × 30 = 2250.
2. What is special about the given data set:
2, 2, 2, 2, 2, 2, 2, 2, 2, 2, 2
(a) Mean and median are equal
(b) Mean, median and mode are all equal
(c) Mean and mode are equal
(d) Median and mode are equal
Answer: (b) Mean, median and mode are all equal
Mean = (2 + 2 + 2 + 2 + 2 + 2 + 2 + 2 + 2 + 2 + 2) / 11 = 22 / 11 = 2.
Median is the middle value or in this case the 6th value = 2.
Mode is the value that occurs the most frequently = 2.
3. If the frequencies of all the observations in a data set are equal then which of the following is true?
(a) A bar graph cannot be formed
(b) The heights of the bars are equal
(c) The widths of the bars are equal
(d) There is only one bar
Answer: (b) and (c)
4. A graph has a scale of 1 unit = 15. What is the frequency of an observation for which the height of the bar is at the 4th unit?
(a) 45
(b) 60
(c) Depends on the observation
(d) Cannot be obtained
Answer: (b) 60
5. We are given the following data set: 1, 2, 3, 2, 2, 3, 3, 1, 3, 3, x. We are given that x is the mode. What is the value of x?
(a) 1
(b) 2
(c) 3
(d) Cannot be obtained from the given information
Answer: (c) 3
In the data set 3 occurs 5 times already, 2 occurs 3 times already and 1 occurs 2 times already.
Therefore, the mode cannot be 2 or 1 and must be 3. So the value of x = 3.
Short Answer and Long Answer Type Questions:
1. You are given the following values: 3, 5, 6, 7, 9. Find a 6th number such that the mean of all the values remains the same?
Answer:
Mean of 3, 5, 6, 7, 9 = (3 + 5 + 6 + 7 + 9)/5 = 6.
Let the 6th number be x.
So the mean to be the same:
(3 + 5 + 6 + 7 + 9 + x)/6 = 6
or, (30 + x)/6 = 6
or, 30 + x = 36
or, x = 36 – 30
or, x = 6 Therefore, the required 6th number = 6.
2. Find 5 numbers between 1/2 and 1/4?
Answer:
We find the mean of 1/2 and 1/4 = (1/2 + ¼)/2 = 3/8 .
Next, we find the mean of 1/2 and 3/8 = (1/2 +3/8)/2 = 7/16 .
Next, we find the mean of 3/8 and 1/4 = (3/8 + ¼)/2 = 5/16 .
Then we find the mean of 1/2 and 7/16 = (1/2 +7/16)/2 = 15/32 .
Lastly, we find the mean of 1/4 and 5/16 = (1/4 +5/16)/2 = 9/32 .
Therefore, 5 numbers between 1/2 and 1/4 are 3/8 , 7/16 , 5/16 , 15/32 , 9/32 .
3. Find the median and mode of the following data set: 25, 23, 25, 34, 29, 23, 24.
Answer:
The data set arranged in ascending order is: 23, 23, 24, 25, 25, 29, 34.
The median of the data set is the middle value, that is 25.
The mode of the data set is the value that occurs the most often. Therefore, here the modes are 23 and 25.
4. In a data set x occurs a times and y occurs b times. What is the mean of the data set?
Answer:
By definition, the mean = (Sum of all observations)/(Number of observations)
In the data set x occurs a times and y occurs b times.
Sum of all observations = (x × a + y × b) and number of observations = (a + b).
Therefore, mean = (xa + yb)/(a+b).
5. Data of car sales for several consecutive years are shown below:
| Year | Number of Cars |
| 2014 | 12000 |
| 2015 | 13500 |
| 2016 | 11000 |
| 2017 | 15000 |
| 2018 | 20000 |
(a) In which years were the car sales less than 15000?
(b) What is the difference between the number of cars sold in the year when sales was maximum and the year when the sales was minimum?
(c) What is the average number of cars sold?
Answers:
(a) From the table, the years in which the car sales were less than 15000 are 2014, 2015, 2016.
(b) Sales was maximum in the year 2018 = 20000.
Sales was minimum in the year 2016 = 11000.
Difference = 20000 – 11000 = 9000.
(c) Average number of cars sold = (12000 + 13500 + 11000 + 15000 + 20000)/5 = 14300.
6. You are given three integers x, y, z. If x is decreased by 3 and z is increased by the same number, how will the mean change?
Answer:
Initial mean = (x + y + z)/3
If x is decreased by 3, we get (x – 3).
If z is increased by 3, we get (z + 3).
New mean = (x – 3 + y + z + 3)/3 = (x + y + z – 3 + 3)/3 = (x + y + z)/3
Therefore, the mean remains the same.
7. The bar graph given below shows the marks in mathematics obtained by a student in classes fifth-ninth.
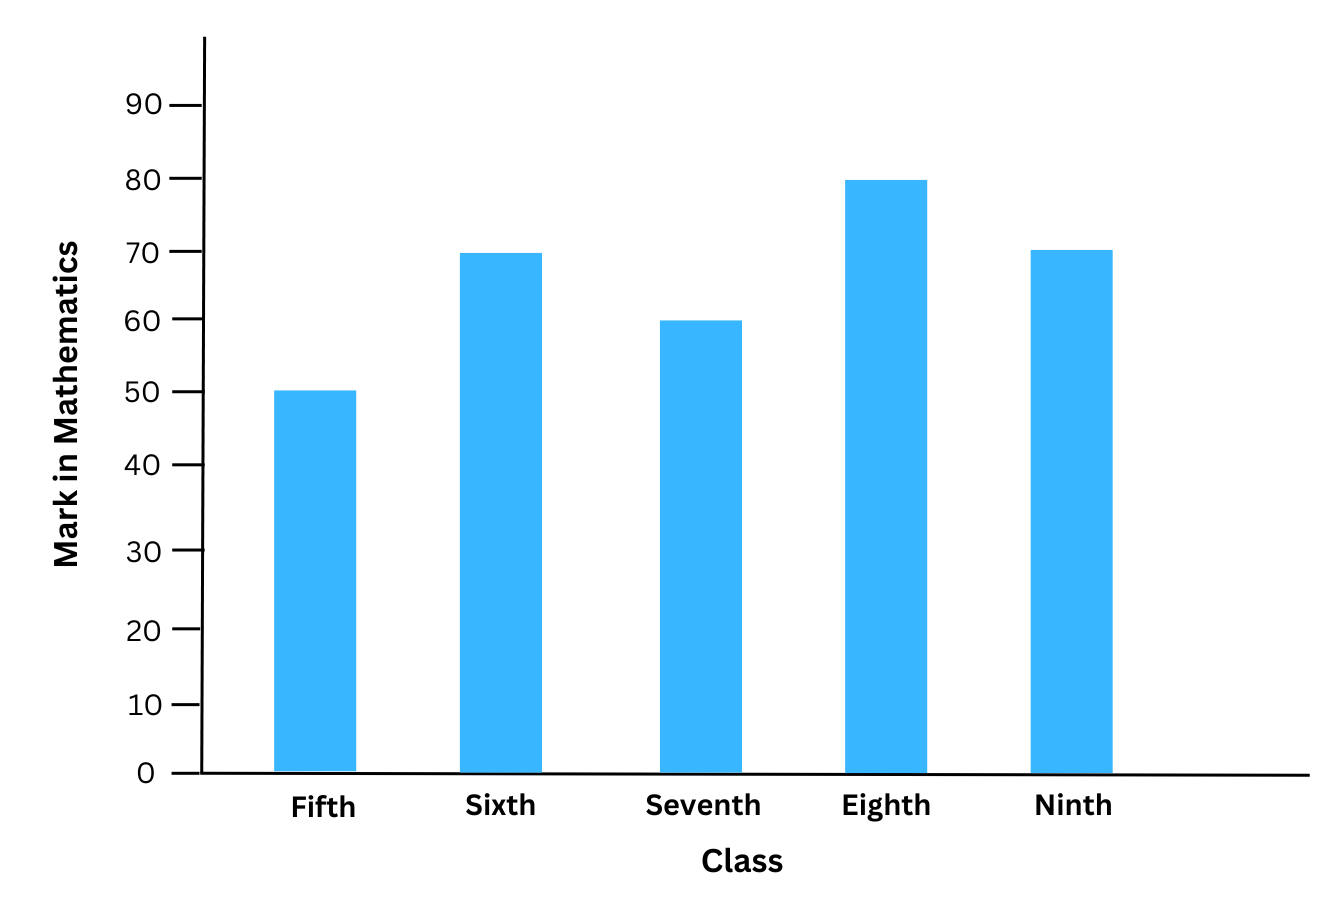
(a) In which class did the student improve the most compared to the previous class?
(b) What is the average mark in mathematics obtained by the student in class fifth-ninth?
(c) In which two classes did the student get the same marks?
(d) What is the range of the marks obtained?
(e) By how much was the marks obtained in the first three classes together more than the marks obtained in the last two classes together?
Answers:
(a) From the bar graph we can see that the student improved the most compared to the previous class in classes sixth and eighth.
(b) Average marks obtained = (50 + 70 + 60 + 80 + 70)/5 = 66.
(c) The student got the same marks in classes sixth and ninth.
(d) Maximum marks obtained = 80 and minimum marks obtained = 50.
Range of marks = 80 – 50 = 30.
(e) Marks obtained in the first three classes together = 50 + 70 + 60 = 180.
Marks obtained in the last two classes together = 80 + 70 = 150.
Therefore, marks obtained in the first three classes together was (180 – 150) = 30 marks more than the marks obtained in the last two classes together.
8. Sale of English and Hindi books in the years 1995, 1996, 1997 and 1998 are given below:
| Years | 1995 | 1996 | 1997 | 1998 |
| English | 350 | 400 | 450 | 620 |
| Hindi | 500 | 525 | 600 | 650 |
Draw a double bar graph and answer the following questions:
(a) In which year was the difference in the sale of the two language books least?
(b) Can you say that the demand for English books rose faster? Justify.
Answers:
The double bar graph based on the given data is shown below:
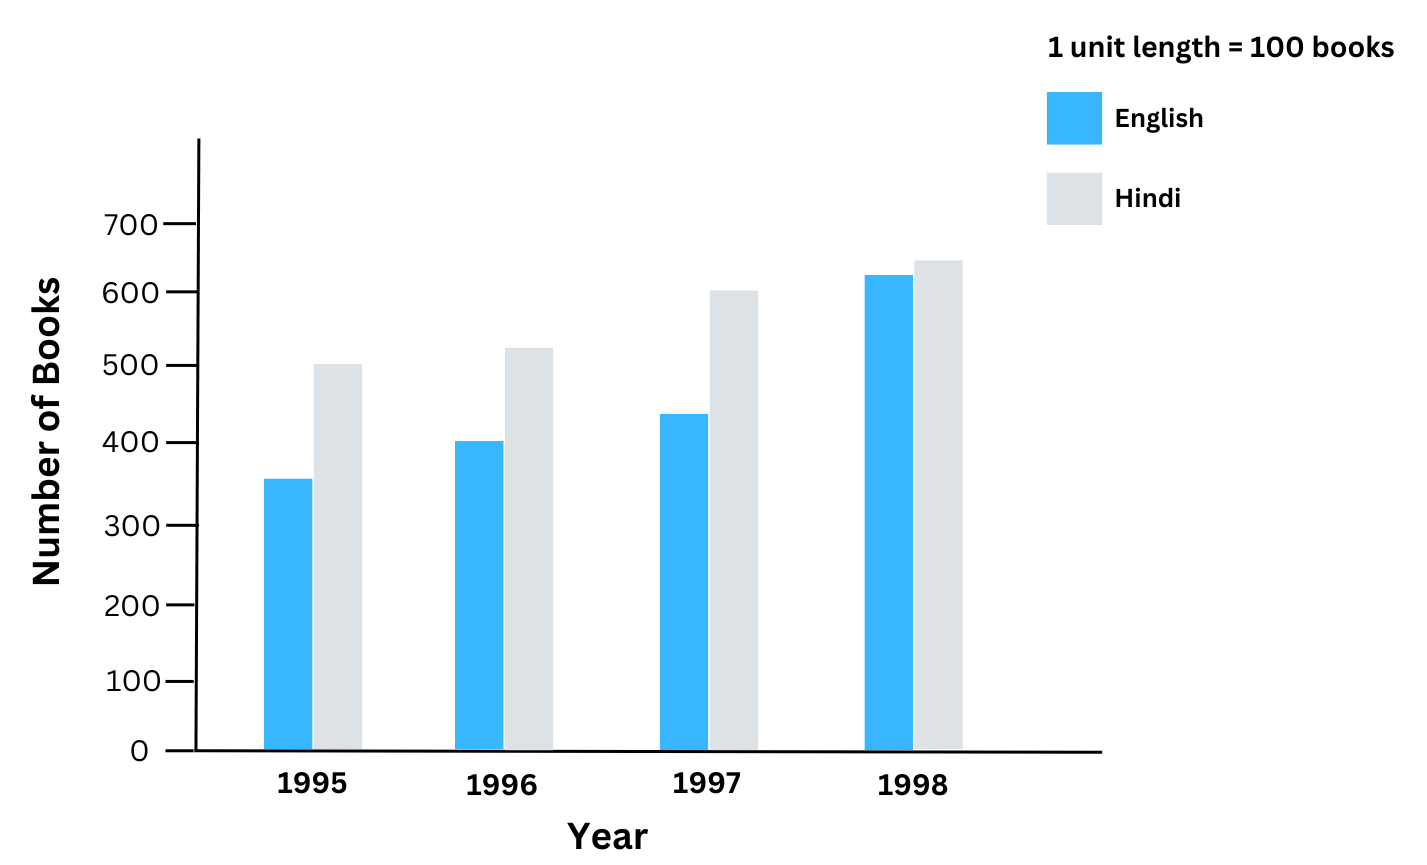
(a) The difference in the sale of the two language books was least in 1998.
(b) No, the demand for English books did not rise faster.
From 1996-1997 sales of English books increased by (450 – 400) = 50 books.
From 1996-1997 sales of Hindi books increased by (600 – 525) = 75 books.
Therefore, from 1996-1997 the demand for Hindi books exceeded the demand for English books.
Therefore, we cannot say that the demand for English books rose faster throughout.
++++++++++++++
Frequently Asked Questions (FAQs) on NCERT Solutions to Class 7 Maths Chapter 3 Data Handling:
Our solutions have been prepared by foreign educated engineers and scientists who have years of experience teaching students of all levels. We understand that you are new to the material and therefore, have taken care to include the right explanations and figures wherever possible. We only ask that you take the time to go through each step carefully – have fun!
Of course, you can download and use the solutions for free! We always strive to provide you with the best study material and will continue to do so in the future. So keep visiting our website and join our email list to stay updated with the latest material!
The main topics covered are:
3.1 – Representative Values
3.2 – Arithmetic Mean
3.3 – Mode
3.4 – Median
3.5 – Use of Bar Graphs with a Different Purpose
Here are the number of problems by each chapter:
Exercise 3.1 – 9 questions
Exercise 3.2 – 5 questions
Exercise 3.3 – 6 questions
Yes indeed! You can download the free PDFs of the solutions (please look towards the top of the page) and use them for practice!
Understand the concepts of mean, median and mode, how they differ from each other and how to calculate each from given data. Learn how to draw bar graphs based on given data and how to answer questions based on given data. Also learn how to do the opposite – answer questions based on given bar graphs.
Our solutions and extra material approach the topic from all angles and will give you excellent practice. They are an excellent place to start. We advise you to learn to work out the problems on your own as well. Data handling requires hands-on practise, looking at the solutions alone won’t help in the long run. If you have trouble with the problems at first (don’t worry, it’s normal!), understand the solutions and then work them out on your own. This will help you internalise the concepts.
As always, we are here for you! If you need any extra help, do not hesitate to reach out to us!
We believe when top-quality teaching is combined with expert mentoring, it can be life-changing. At educationroundtheworld.com, we follow the ‘teacher-mentor’ approach where a dedicated teacher-mentor will train you and mentor you regarding your future careers as well. If that sounds good to you, feel free to contact us anytime. We provide tailored one-to-one coaching and mentoring, based on your convenience and your needs – have it completely your way! Book an appointment now!