Hello students! Looking for lucid and well-written answers to guide you?
We’ve designed a comprehensive solutions package tailored just for you. This all-in-one resource provides detailed answers to all exercise questions, in-text questions, and activities. Enriched with clear explanations, these solutions will not only help you excel in Class 9 economics but also establish a strong base for advanced studies. Everything you need is conveniently compiled here—just dive in and enjoy learning!
Say goodbye to the hassle of scouring the internet for answers. Study stress-free, build confidence, and unlock your full potential. You’ve got this! Good luck!
Find Solutions for NCERT Class 9 Economics Chapter 3: Poverty as a Challenge, here.
Exercises
1. Describe how the poverty line is estimated in India
Answer:
“Poverty line” is a concept used to measure vulnerability of certain communities, say members of a backward class, to poverty. Poverty is based on the income and consumption levels. A person is considered poor if his or her income or consumption level falls below a certain ‘minimum level’ which is termed as ‘poverty line’.
While determining the poverty line in India a minimum level of food requirement, clothing, footwear, fuel and electricity, educational and medical needs are considered as the bare minimum for subsistence. The quantities are then multiplied by their prices in rupees to see if the incomes are sufficient to meet basic living standards. The primary factor here is food requirement per family or calorie requirements. The monetary expenditure required for buying the calorie needs of a person is the main marker of poverty line.
It differs from rural to urban areas as calorie requirements in these areas vary. In 2011-12 it was estimated that a family of five persons living in rural area had to earn Rs.4080 or more per month to remain above poverty line. Because of higher prices (but less calorie needs) a similar family in urban areas would need Rs.5000 per month as basic living standard. Poverty line measures the basic living standard of a country.
2. Do you think that present method of poverty estimation is appropriate?
Answer:
The present method of poverty estimation is not appropriate because of the following factors:
(i) The method only considers the lowest quality of food that seldom fulfils the calorie requirement.
(ii) It does not consider price fluctuation at different times.
(iii) Does not consider caste factors when poverty among lower castes is much higher.
(iv) Does not consider the inter-state differences in standard and takes an average standard. For example, the poverty index in Punjab is lower than say in a state like Jharkhand. So, averaging does not present a realistic picture.
3. Describe the poverty trends in India since 1973.
Answer:
Table 3.1 indicates a substantial decline in poverty ratios in India from about 45% in 1993-94 to 37.2% in 2004-2005. Further downward trend was seen as the figure came down to 22% in 2011-12. The number of poor people living under poverty also declined in the two decades of 70s and 80s The number of poor people in 1973 was 407 million compared to 270 million in 2004-05 which was which was a huge decline.
4. Describe the major reasons for poverty in India
Answer:
Every fifth person in India is poor. The major reasons for poverty in India can be summarised as follows:
1. Landlessness: India is primarily an agricultural country but 30% of the farmers are landless and work as daily labour for minimum wages which can sometimes be as low as Rs100 per day.
2. Unemployment: Disguised unemployment in rural sector where more than necessary manpower is engaged in unremunerative work. In urban areas also there is massive unemployment among educated youth.
3. Size of families: Because of population explosion the size of an Indian family is big where one person is the bread earner while others share it.
4. Illiteracy: India has to bear the burden of huge illiteracy even today which is an impediment to wealth creation.
5. Poor health and malnutrition: Poor health and malnutrition restrict the people’s productive capacity. Child labour engaged for low wages prolongs poverty
6. Helplessness: People are caught in a vicious cycle of unemployment – low wages – very little purchasing power – no savings and then back to poverty. For millions of our people, it is extremely difficult to break out of it.
5. Identify the social and economic groups which are most vulnerable to poverty in India
Answer:
The scale of poverty is not same among all social groups in India, the most vulnerable are those belonging to Scheduled Caste and Scheduled Tribes.
Among the economic groups, rural landless agricultural labour and urban casual workers are the most vulnerable.
The average of people from all groups living below poverty line i.e. subsistence level, is 22% while we see that 43% of the Scheduled Tribe and 29% of Scheduled Caste households are not able to meet their basic needs.
Similarly, 34% of casual workers in urban areas are below poverty line.
The Scheduled Tribes and Scheduled Castes have the double disadvantage of been economically handicapped and at the same time socially stigmatised.
It seems rural agricultural workers which include people from the Scheduled Caste and Tribes and the urban casual workers are the most vulnerable groups as far poverty and discrimination are concerned. This is also the primary reason of inequality in India although official data suggest that poverty among these groups is declining.
6. Give an account of the inter state poverty in India
Answer:
Poverty in India is not uniformly spread all over the country with some states markedly poorer than others. In other words, the concentration of poor people is not the same everywhere. While the average HCR (Head Count Ratio) *of poverty in India was 21.9%, poverty levels in different states varied from 7.1 in Kerala to 33.7 in Bihar. It showed that poverty did not decline uniformly all over India.
If we compare, we see there has been a significant decline in poverty in Punjab, Haryana, Kerala, Maharashtra, Tamil Nadu, Gujarat and West- Bengal. But it is not the case with states like Odisha, Bihar, Uttar Pradesh and Madhya Pradesh where the HCR is much above the national average.
States like Punjab and Haryana have successfully reduced poverty levels taking advantage of the green revolution which boosted the agricultural output.
Kerala focussed more on human resource development and West-Bengal took the land reform route for the benefit of larger number of farmers.
In Andhra Pradesh and Tamil Nadu, the public distribution system was used effectively and this helped in alleviation of poverty.
But in Odisha, Madhya Pradesh and Bihar these facilities were lacking and along with urban unemployment these states remained poorest of all.
* The Head Count Ratio (HCR) is the percentage of a population that falls below the Poverty Line.
7. Describe the global poverty trends
Answer:
In the global scenario, levels of abject poverty have declined from 36% in 1996 to 10% in 2015. Extreme poverty is characterised by an income of less than $1.90 per day.
Fortunately, the poverty level has declined in recent times. But this reduction has strong regional differences. For example, poverty declined substantially in China and South Asian countries with rapid economic growth. Massive investments in human resource development paid off. Number of poor people in China has come down from 88.3 per cent in 1981 to 14.7 per cent in 2019. In South Asian countries like India, Pakistan, Sri Lanka, Bangladesh, Nepal and Bhutan the decline is also noteworthy – from 34% in 2005 to 15.2% in 2014.
In Sub-Saharan countries in Africa poverty has declined from 51% in 2005 to 40.2% in 2018. Poverty in Latin America has declined from 10% in 2005 to 4% in in 2018.
But poverty has resurfaced in countries like Russia and East- European countries. Thus, we see there has been substantial poverty alleviation throughout the world but not at the same rate in every country. This is because of differences in poverty line definition in each country. The following chart will show the differences in poverty levels in some countries across the continent:
| Country | % of Population below $1.90 a day |
| 1, Nigeria 2. Bangladesh 3. India 4. Pakistan 5. China 6. Brazil 7. Indonesia 8. Sri Lanka | 39.1 (2018) 14.5 (2016) 22.5 (2011) 4.0 (2015) 0.5 (2016) 4.4 (2018) 3.6 (2018) 0.9 (2016) |
8. Describe the current government strategy of property alleviation
Answer:
Indian Government is deeply committed to take effective measures for poverty alleviation. Three decades from early fifties to early eighties did not see significant improvement in per capita income and consequently very little reduction in poverty. The current anti-poverty strategy of the government has two focus areas:
(i) Promotion of economic growth
(ii) Targeted anti-poverty programmes
It was seen that when the growth rate jumped from 3.5% a year in the 1970s to about 6% during 1980s and 1990s it helped significantly in reduction of poverty. It was therefore evident that there was a strong link between economic growth and poverty alleviation.
Economic growth widens opportunities and provides the resources needed to invest in human development. People start sending their children to school in the hope of getting some return from investment in education. Moreover, growth in the agricultural sector had to be pulled up as much as possible since most poor people live in villages and are dependent on agriculture. So, promotion of economic growth is of utmost priority to government.
To reduce poverty on a national scale, the government has adopted some well-directed programmes described below:
(a) Mahatma Gandhi National Rural Employment Guarantee Act, 2005. The act aims to provide 100 days of wage employment to ensure food security in rural areas.
(i) The scheme aims at sustainable development to address the cause of draught, deforestation and soil erosion where people can be employed. One-third of the proposed jobs have been reserved for women. It provided employment to 220 crores person days to 4.78 crore households. The share of SC, ST, and Women was 23%, 17% and 53% respectively.
(ii) The wage rate of unskilled manual workers has been revised. State-wise the wage rate lies between ₹ 281 per day to ₹168 per day.
(b) Prime Minister Rojgar Yojana (PMRY) is another scheme started in 1993. The aim of this scheme was to create self-employment opportunities for educated unemployed youth in rural areas and small towns. The scheme has helped in setting up of small businesses and industries.
(c) Rural Employment Generation Programmed (REGP) was launched in 1995. The aim of this scheme was to create self-employment opportunities in rural areas and small towns.
(d) Swarnajayanti Gram Swarojgar Yojana (SGSY) was launched in 1999 to lift assigned poor families out of poverty by organising them into Self Help groups through a mix of bank credit and government subsidy.
(Pradhan Mantri Gramodaya Yojana (PMGY) launched in 2000 provides additional central assistance to states for improved facilities in primary health, primary education, rural shelter, rural drinking water and rural electrification.
The schemes listed above could not bring off optimum results because of lack of proper implementation. As a result, the benefits of these schemes did not fully reach the deserving poor.
(9) Answer the following questions briefly:
(i) What do you understand by human poverty?
Answer:
Poverty is the inability of a personto meet the basic minimum needs of life like food, clothing footwear, fuel, electricity, education and medical exigencies due to insufficient income. A common method used to measure poverty is based on the income or consumption levels. A person is considered poor if his or her income or consumption level falls below a given ‘minimum level’ necessary to fulfil the basic needs of life stated above.
(ii) Who are the poorest of poor?
Answer:
The average percentage of people below poverty for all social groups in India is 22%. But the percentage is much higher in case of Scheduled Tribes at 43% and 34% in respect of urban workers. These two groups are not able to meet the basic needs of life and can be categorised as the poorest of poor.
(iii) What are the main features of the National Rural Employment Guarantee Act of 2005?
Answer:
The main features of the Mahatma Gandhi National Rural Employment Guarantee Act are as follows:(a)The act aims to provide 100 days of wage employment to every household to ensure livelihood security in rural areas.
(b) One third of the proposed jobs are reserved for women.
(c) In 2018 the daily state wise wage rate been fixed in a range of Rs 281 to Rs 168
(d) The scheme aims at sustainable development to address the cause of draught, deforestation and soil erosion.
Solutions to In–Text Questions NCERT Class 9 Economics Chapter 3: Poverty as a Challenge
Let’s Discuss (Page 32)
Why do different countries use different poverty lines?
Answer:
The given minimum level of consumption which is a marker of poverty differs from country to country because existing development levels and consumption levels are not same everywhere. Each country uses an imaginary line that is considered appropriate for its existing level of development and its minimum standard of living. So, poverty lines differ from country to country.
What do you think would be the “minimum necessary level “in your locality?
Answer:
I live in a middle-class area in a metropolitan city. I think that the minimum necessary consumption level for a family of five can be estimated as follows:
(i) Food requirement: Rs. 15000 p.m.
(ii) Clothing: Rs. 2000 p.m.
(iii) Fuel Rs. 1000 p.m.
(iv) Electricity: Rs. 2000 p.m.
(v) Medicine: Rs. 2000 p.m.
(vi) Education: Rs. 8000 p.m.
Total Rs. 30000 p.m.
Let’s Discuss: Page 33
Study Table 3.1 and answer the following questions:
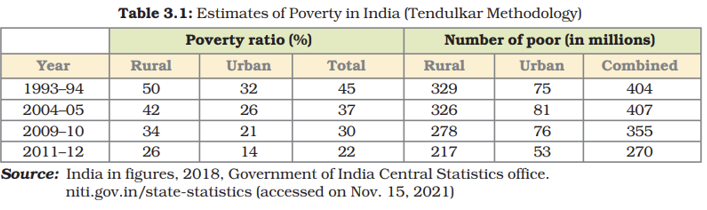
Even if the poverty ratio declined between 1993-94 and 2004-05, why did the number of poor remain at about 407 million?
Answer:
Although the poverty ratio decreased from 45% to 37% between 1993-94 and 2004-05, the number of poor did not decrease much and remained almost same. This was due to population increase that outpaced the fall in poverty ratio.
Are the dynamics of poverty reduction the same in rural and urban India?
Answer:
No, the dynamics of poverty reduction differ in rural and urban India. Table 3.1 shows that poverty ratio in rural India declined from 50% to 26 % during the period from 1993-94 to 2011-12. During the same period, urban poverty ratio decreased from 32% to 14%. The rural areas have dense concentration of Scheduled Caste, Scheduled Tribe households as well as landless labourers who are the poorest of the poor. Moreover, the population growth is higher in rural areas, so the poverty reduction measures are not as successful as they should have been.
Let’s Discuss – Page 35
Observe some of the poor families around you and try to find the following:
Which social and economic group do they belong to?
Answer:
The poor people in my locality mostly belong to Scheduled Caste and work as urban casual workers.
Who are the earning members of the family?
Answer:
In most cases the women are earning members of the family working as housemaids.
What is the condition of the old people in the family?
Answer:
The old people live a life of neglect and are dependent on free health care provided by the government.
Are all children attending schools?
Answer:
Most children, boys and girls attend school but dropout rate among girls is high.
Let’s Discuss – page 36
Study graph 3.2 and do the following:
1. The three states where the poverty ratio is the highest.
Answer:
The states with highest poverty ratio are, Bihar, Odisha and Assam.
2. Identify the three states where poverty level is the lowest
Answer:
The three states with the lowest poverty level are Kerala, Himachal Pradesh and Punjab.
Let’s Discuss- page 36
Study graph 3.4 and answer the following:
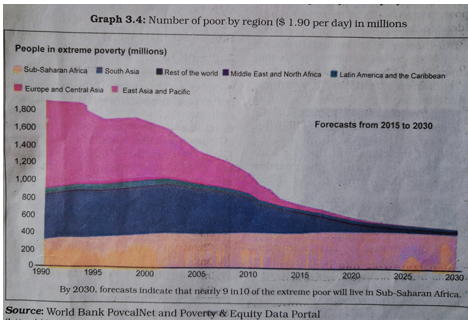
Identify the areas of the world where poverty ratios have declined.
Answer:
The three areas of the world where the poverty ratio has substantially decreased are:
East Asia and the Pacific
South Asia
Latin America and the Caribbean
Identify the area of the globe which has the largest concentration of the poor
Answer:
Graph 3.4 shows that the largest concentration of the poor is in sub- Saharan Africa.
Frequently Asked Questions (FAQs) on NCERT Class 9 Economics Chapter 3: Poverty as a Challenge
Our team of competent subject experts has thoughtfully crafted these solutions to ensure they are not only accurate but also engaging and easy to understand. Every concept is explained in a lucid and clear manner, making learning enjoyable and helping you grasp the material with ease.
We encourage you to dive into these solutions, as they’re designed to clarify all your doubts and strengthen your understanding of the lesson. You can download the free PDFs anytime for easy access!
And there’s even more on the way—exciting study material and helpful resources are coming soon! Keep visiting our website and don’t forget to join our email list to stay updated and gain free access to all the new content. Happy learning!
The following topics are covered in Economics Chapter 3 ‘Poverty as a Challenge’
Typical cases of Poverty: Urban, Rural
Social Exclusion
Vulnerability
Poverty Line
Poverty Estimates
Vulnerable Groups
Inter-state Disparities
Global Poverty Scenario
Causes of Poverty
Anti-Poverty Measures
Our team of skilled subject teachers has carefully thought through every question you may have about Chapter 3 ‘Poverty as a Challenge’ and created these solutions to guide you through each important concept. These solutions not only cover the key details but also help you fully understand the lesson.
Chapter 3 ‘Poverty as a Challenge’ discusses one of the most pressing problems confronting our society. As you go through the solutions, take time to read each explanation, and practise writing out your answers under timed conditions. This practice will not only help you understand better but also make you feel more confident, ready to answer any question that comes your way. Remember, with practice and a positive spirit, you’ll be well-prepared. We’re cheering for you all the way—keep going, and good luck!
Are you worried about your studies and your future? Struggling to find the right teacher-mentor to guide you? You’re not alone—we understand the confusion and stress that comes with it. But don’t worry, we have the perfect solution for you.
At educationroundtheworld, we know how important it is to find the right support. Our expert teacher-mentors are here to help you cut through the confusion and guide you on the right path. We’ve designed our coaching to ease your worries and focus on what matters most—your success.
Here’s how it works: Reach out to us or book your first session, and we’ll work together to create a clear, personalized study plan tailored just for you. With our guidance, you’ll feel confident, secure, and ready to face your future with a plan that works.
Say goodbye to confusion and anxiety—start your journey to success today with our expert guidance!