Hello students! Welcome to Chapter 9 solutions! Find top-quality solutions to all exercise questions and extended learning activities, in-text questions, activities along with extra questions of many formats. The attractive figures we have included will help you learn and visualize the concepts even better, so we suggest that you study them carefully.
Solutions to Exercises (Page No 105) of NCERT Class 7 Science Chapter 9 Motion and Time:
1. Classify the following as motion along a straight line, circular or oscillatory motion:
(i) Motion of your hands while running.
(ii) Motion of a horse pulling a cart on a straight road.
(iii) Motion of a child in a merry-go-round.
(iv) Motion of a child on a see-saw.
(v) Motion of the hammer of an electric bell.
(vi) Motion of a train on a straight bridge.
Answers:
(i) Periodic or oscillatory motion since when you run your hands move to and fro repeatedly in the same manner.
(ii) Motion along a straight line as the horse pulls the cart in one direction on the straight road.
(iii) Circular motion sincethe merry-go-round rotates in a circular fashion.
(iv) Periodic or oscillatory motion since the see-saw moves up and down repeatedly in the same manner.
(v) Periodic or oscillatory motion since the hammer of an electric bell moves to and fro repeatedly in the same manner.
(vi) Motion along a straight line or linear motion as the train moves straight in one direction on the bridge.
2. Which of the following are not correct?
(i) The basic unit of time is second.
(ii) Every object moves with a constant speed.
(iii) Distances between two cities are measured in kilometres.
(iv) The time period of a given pendulum is constant.
(v) The speed of a train is expressed in m/h.
Answer:
The incorrect statements are: (ii) Every object moves with a constant speed and (v) The speed of a train is expressed in m/h.
Explanations:
(i) The basic unit of time is second.
The statement is correct. We all know that the basic unit of time that we use is second, while the larger units of time are minutes and hours.
(ii) Every object moves with a constant speed.
The statement is incorrect. Objects can move with different speeds during different phases of their journey. The speed of the object does not always have to be constant.
(iii) Distances between two cities are measured in kilometres.
The statement is correct. It is convenient to measure the huge distance between two cities in ‘kilometres’ instead of say ‘metres’ because kilometre is much larger than metre.
(iv) The time period of a given pendulum is constant.
The statement is correct.The time period of a given pendulum depends only on its length.
(v) The speed of a train is expressed in m/h.
The statement is incorrect. The train is very fast and travels a huge distance in an hour. Since kilometre is much larger than metre, km/h would be a more convenient and practical way to express the speed than say m/h.
3. A simple pendulum takes 32 s to complete 20 oscillations. What is the time period of the pendulum?
Answer:
To complete 20 oscillations the simple pendulum takes 32 s.
Therefore, to complete 1 oscillation the simple pendulum takes 32s/20 = 1.6 s.
The time period is the time taken by the pendulum to complete 1 oscillation.
So, the time period of this pendulum = 1.6 s.
4. The distance between two stations is 240 km. A train takes 4 hours to cover this distance. Calculate the speed of the train.
Answer:
Total distance covered by the train = 240 km.
Total time taken by the train to cover the distance = 4 hours.
Therefore, speed of the train = (Total distance covered)/(Total time taken) = (240 km)/(4 hr) = 60 km/hr.
5. The odometer of a car reads 57321.0 km when the clock shows the time 08:30 AM. What is the distance moved by the car, if at 08:50 AM, the odometer reading has changed to 57336.0 km? Calculate the speed of the car in km/min during this time. Express the speed in km/h also.
Answer:
Reading of the odometer at 08:30 AM = 57321.0 km.
Reading of the odometer at 08:50 AM = 57336.0 km.
Therefore, the distance moved by the car between 08:30 AM and 08:50 AM = (57336.0 – 57321.0) km = 15 km.
Time taken by the car to travel 15 km = (08:50 – 08:30) AM = 20 minutes.
Speed in km/min = (Total distance covered)/(Total time taken) = (15 km)/(20 min) = 0.75 km/min.
1 minute = 1/60 hr
20 minutes = 20 × 1/60 hr = 1/3 hr
Speed in km/h = (Total distance covered)/(Total time taken) = (15 km)/(1/3 hr) = 45 km/hr.
Summary: The odometer of a car reads 57321.0 km when the clock shows the time 08:30 AM. If at 08:50 AM, the odometer reading has changed to 57336.0 km,the distance moved between 08:30 AM and 08:50 AM = 15 km. Speed of the car in km/min = 0.75 km/min and Speed in km/h = 45 km/hr.
6. Salma takes 15 minutes from her house to reach her school on a bicycle. If the bicycle has a speed of 2 m/s, calculate the distance between her house and the school.
Answer:
The time taken by Salma to cover the distance between her house and the school = 15 minutes.
1 minute = 60 s.
15 minutes = 15 × 60 s = 900 s.
Speed = (Total distance covered)/(Total time taken)
or, Total distance covered = Speed × Total time taken
or, Total distance covered = 2 m/s × 900 s = 1800 m.
1 m = 1/1000 km
or, 1800 m = 1/1000 × 1800 km = 1.8 km.
Summary: Salma takes 15 minutes from her house to reach her school on a bicycle. If the bicycle has a speed of 2 m/s, the total distance between Salma’s house and the school = 1.8 km.
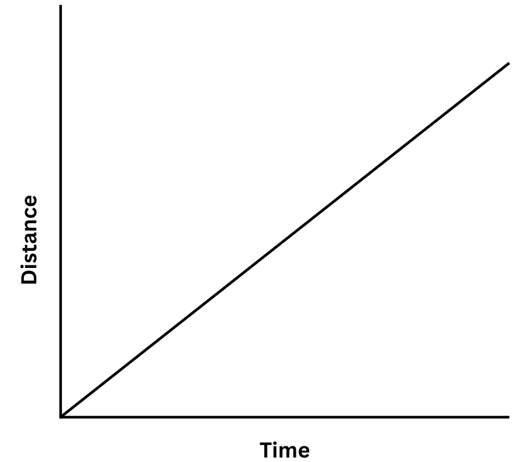
7. Show the shape of the distance-time graph for the motion in the following cases:
(i) A car moving with a constant speed.
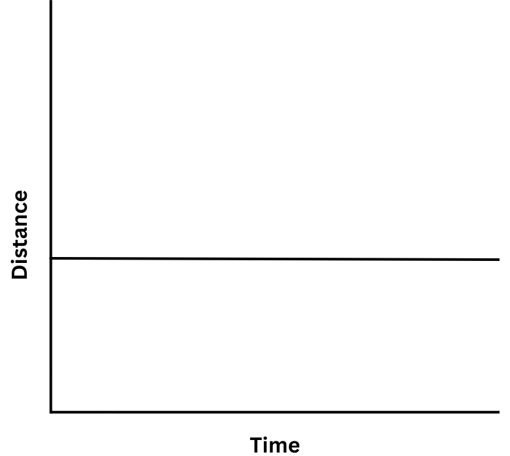
(ii) A car parked on a side road.
Answers:
(i) A car moving with a constant speed.
The shape of the distance-time graph for a car moving with a constant speed is a straight line. Take multiple points on the line, find the values of distance and time for each point and use the formula Speed = Distance/Time. The value of speed will be same for each point.
(ii) A car parked on a side road.
The shape of the distance-time graph for a parked car or a car with no motion will be a horizontal straight line parallel to the x-axis which we have chosen to represent time. Notice that the distance does not change with time, indicating that the car is at rest.
8. Which of the following relations is correct?
(i) Speed = Distance × Time (ii) Speed = Distance/Time
(iii) Speed = Time/Distance (iv) Speed = 1/(Distance x Time)
Answer: (ii) Speed = Distance/Time is the correct relation.
9. The basic unit of speed is:
(i) km/min (ii) m/min
(iii) km/h (iv) m/s
Answer: (iv) m/s is the basic unit of speed. The unit of distance is taken as metre (m) and the unit of time is taken as second (s) and Speed = Distance/Time.
10. A car moves with a speed of 40 km/h for 15 minutes and then with a speed of 60 km/h for the next 15 minutes. The total distance covered by the car is:
(i) 100 km (ii) 25 km
(iii) 15 km (iv) 10 km
Answer:
We know that Speed = Distance/Time .
or, Distance = Speed × Time
The car moves with a speed of 40 km/h for the first 15 minutes or 15/60 h = 1/4 h = 0.25 h.
Therefore, the distance covered in the first 15 minutes = Speed × Time = 40 km/h × 0.25 h = 10 km.
The car moves with a speed of 60 km/h for the next 15 minutes or 15/60 h = 1/4 h = 0.25 h.
Therefore, the distance covered in the second 15 minutes = Speed × Time = 60 km/h × 0.25 h = 15 km.
Therefore, the total distance covered by the car = (10 + 15) km = 25 km.
Summary: A car moves with a speed of 40 km/h for 15 minutes and then with a speed of 60 km/h for the next 15 minutes. The total distance covered by the car is 25 km.
11. Suppose the two photographs, shown in Fig. 13.1 and Fig. 13.2, had been taken at an interval of 10 seconds. If a distance of 100 metres is shown by 1 cm in these photographs, calculate the speed of the fastest car.
Answer:
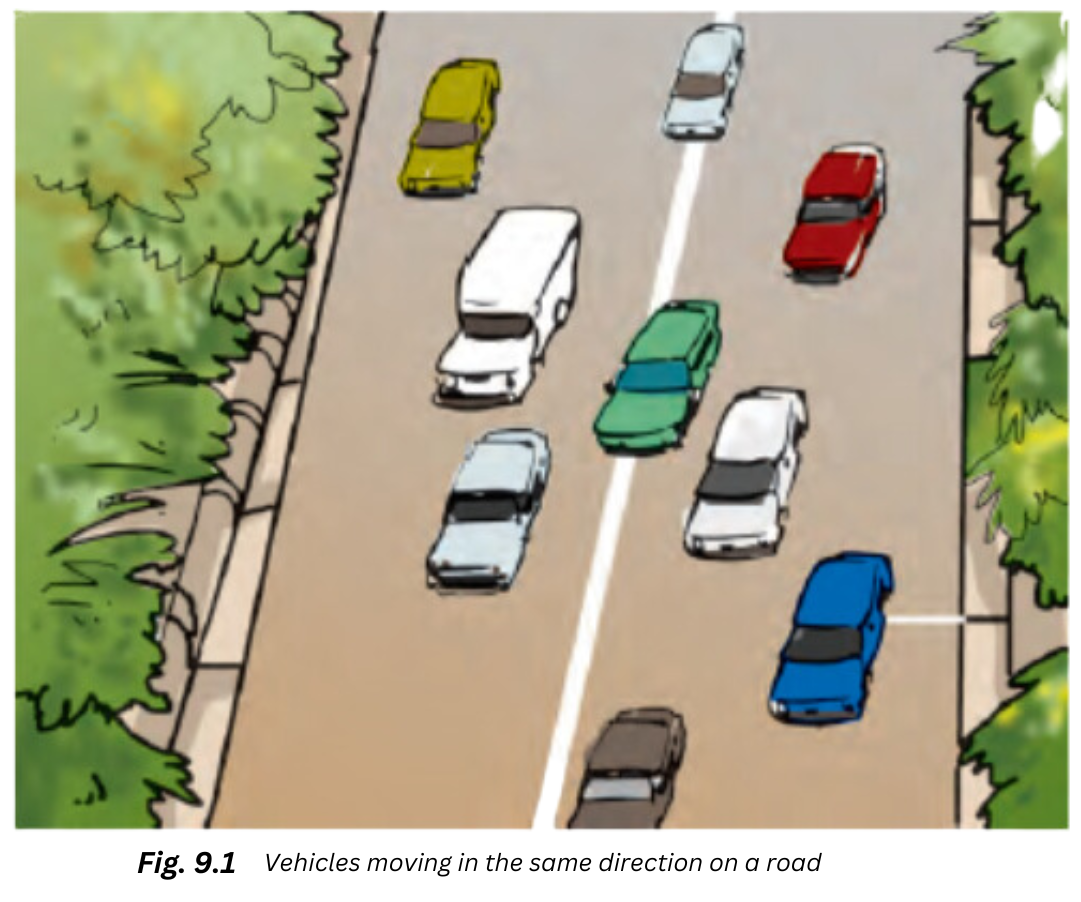
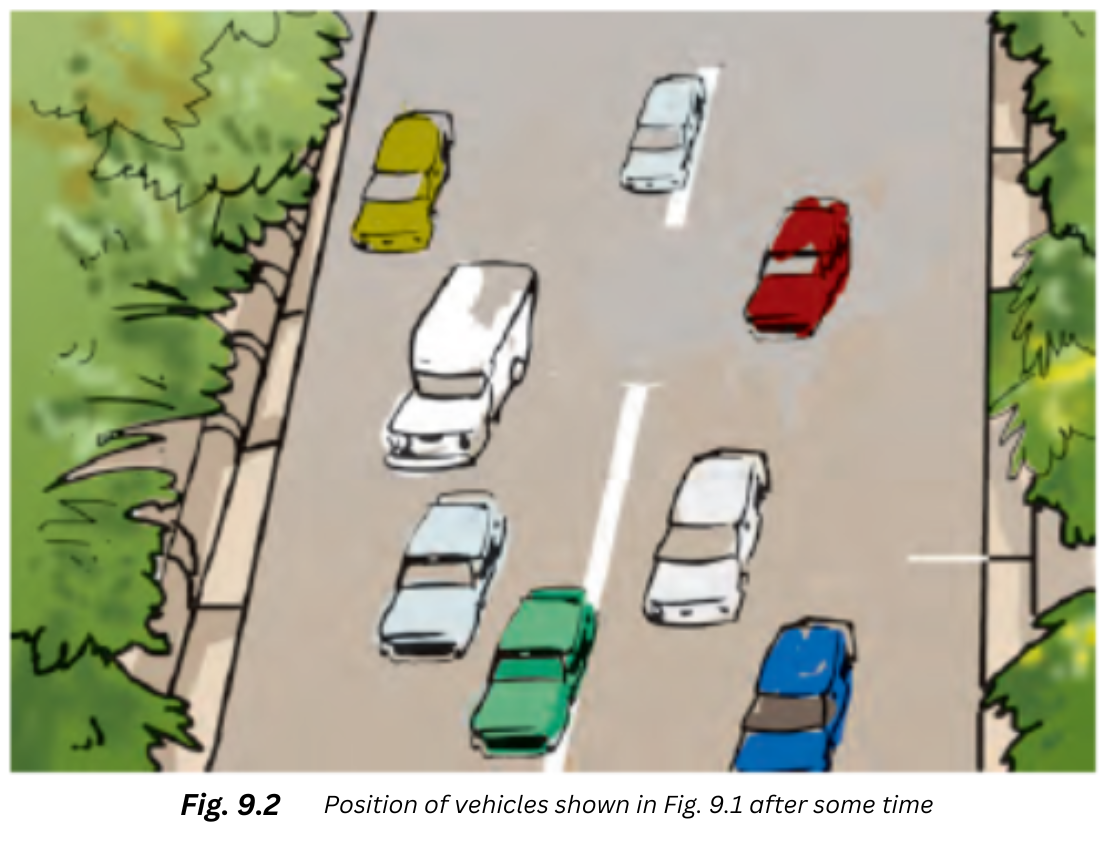
By studying the two figures we can tell that the green car covered the largest distance in the given time interval of 10 seconds.
Using the ruler in your geometry box you can measure the length that the car has travelled = 3.2 cm.
We are given that 1 cm length in the photograph = 100 metres of actual distance.
Therefore, 3.2 cm length in the photograph = 3.2 × 100 metres = 320 metres of actual distance.
So, the green car (fastest) took 10 seconds to cover 320 metres of actual distance.
We know that Speed = Distance/Time .
or, Speed = (320 m)/(10 s) = 32 m/s
Therefore, the speed of the fastest car which is the green car = 32 m/s.
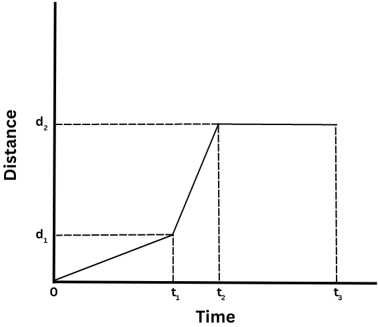
12. Fig. 13.15 shows the distance-time graph for the motion of two vehicles A and B. Which one of them is moving faster?
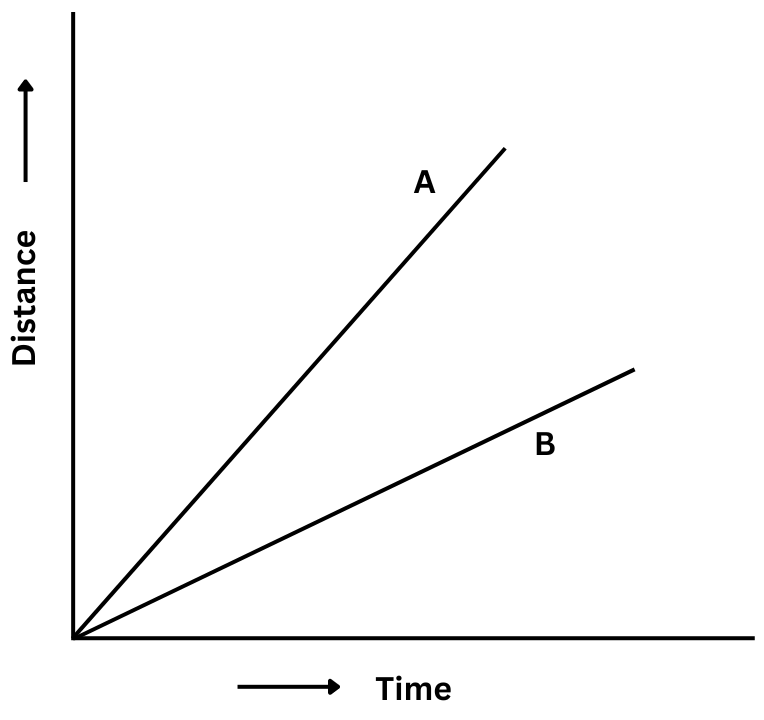
Answer: The car that has covered the greater distance in a given time will have the greater speed.
Let us choose a given time t on the x-axis which represents time and draw a perpendicular line which cuts the graphs for both vehicles A and B.
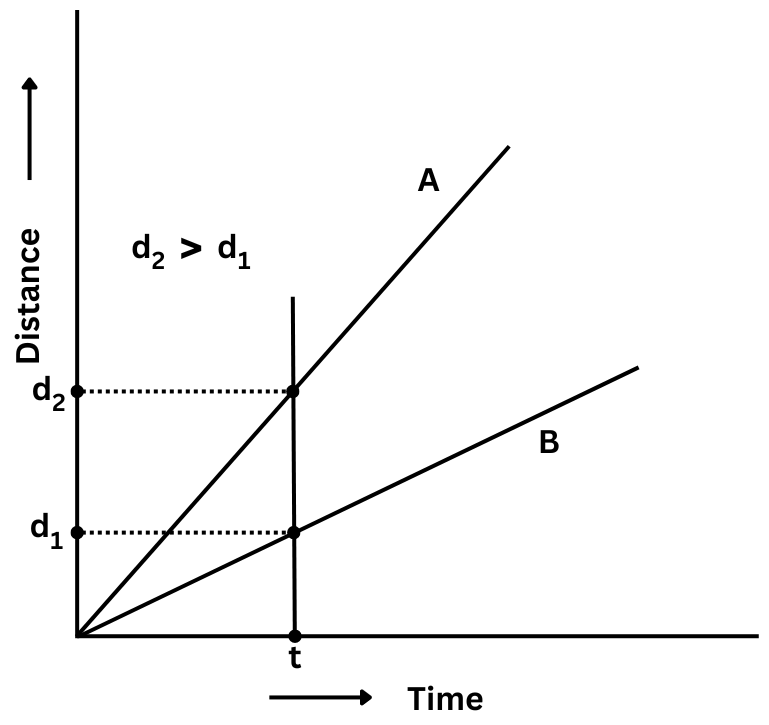
After time t, the vehicle A covers a distance d2 and the vehicle B covers a distance d1 and d2 > d1. It is easy to see that the same result holds for any time other than t.
We can conclude from the graph, that after any given time vehicle A will have covered a greater distance than vehicle B and so the speed of vehicle A is greater than vehicle B. Hence, vehicle A is moving faster than vehicle B.
13. Which of the following distance-time graphs shows a truck moving with speed which is not constant?
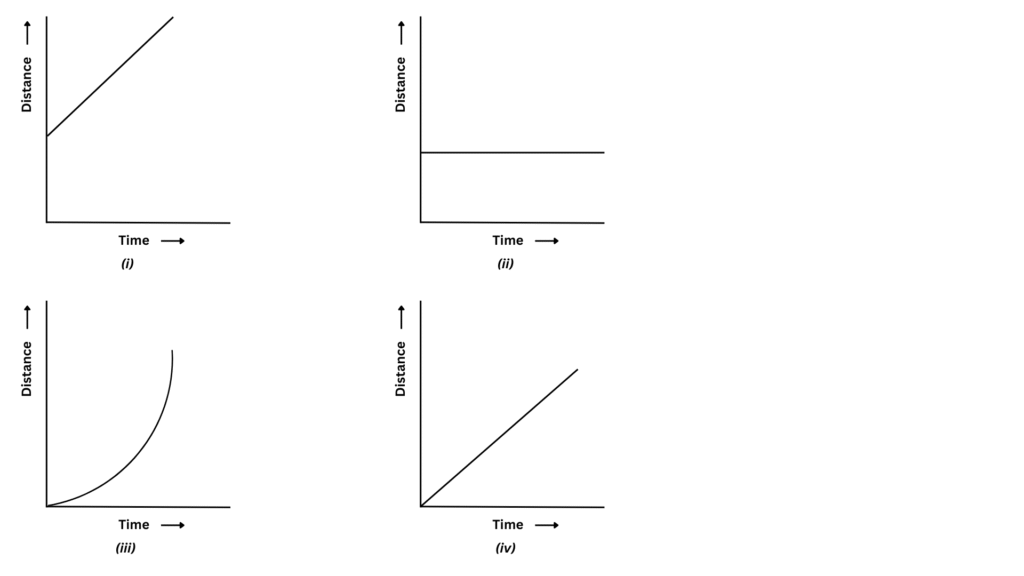
Answer: (iii) is the graph showing a truck moving with speed which is not constant because you can estimate from the curved graph that a greater distance is covered in a later time period than in an earlier time period of the same magnitude. This indicates the speed of the truck is increasing with time.
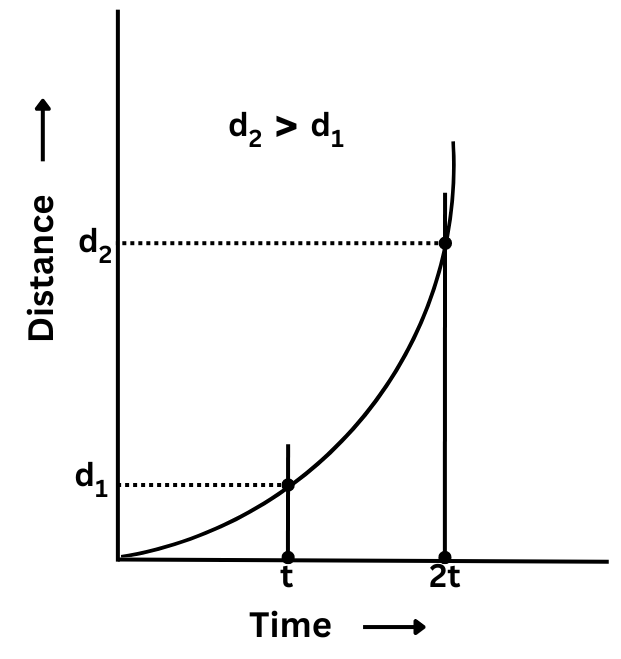
Let us choose two points t and 2t on the time-axis and draw two perpendicular lines passing through t and 2t which cut the graphs at two points. Then from those points draw two horizontal lines cutting the distance-axis at d1 and d2.
The distance covered after time t is d1.
The distance covered after time 2t is d2.
So, the distance covered during the first time period of length t = d1 and the distance covered during the second time period of length t (2t – t = t) = (d2 – d1).
It is easy to see from the graph that (d2 – d1) > d1.
Hence, the truck covers a greater distance during the second time period of length t than the first time period of length t, indicating that the speed of the truck is increasing and is not constant.
Solutions to Extended Learning – Activities and Projects (Page No 107) of NCERT Class 7 Science Chapter 9 Motion and Time:
1. You can make your own sundial and use it to mark the time of the day at your place. First of all find the latitude of your city with the help of an atlas. Cut out a triangular piece of cardboard such that its one angle is equal to the latitude of your place and the angle opposite to it is a right angle. Fix this piece, called gnomon, vertically along a diameter of a circular board as shown in Fig. 13.16. One way to fix the gnomon could be to make a groove along a diameter on the circular board.
Next, select an open space, which receives sunlight for most of the day. Mark a line on the ground along the North-South direction. Place the sundial in the sun as shown in. Mark the position of the tip of the shadow of the gnomon on the circular board as early in the day as possible, say 8:00 AM. Mark the position of the tip of the shadow every hour throughout the day. Draw lines to connect each point marked by you with the centre of the base of the gnomon as shown in the figure. Extend the lines on the circular board up to its periphery. You can use the sundial to read the time of the day at your place. Remember that the gnomon should always be placed in the North-South direction as shown in the figure.
Answer:
Solution to Extended Learning Problem 1
2. Collect information about time measuring devices that were used in the ancient times in different parts of the world. Prepare a brief write up on each one of them. The write up may include the name of the device, the place of its origin, the period when it was used, the unit in which the time was measured by it and a drawing or photograph of the device, if available.
Answer:
Solution to Extended Learning Problem 2
3. Make a model of a sand clock which can measure a time interval of 2 minutes (Fig. 9.17).
Answer:
Solution to Extended Learning Problem 3
4. You can perform an interesting activity when you visit a park to ride a swing. You will require a watch. Make the swing oscillate without anyone sitting on it. Find its time period in the same way as you did for the pendulum. Make sure that there are no jerks in the motion of the swing. Ask one of your friends to sit on the swing. Push it once and let it swing naturally. Again measure its time period. Repeat the activity with different persons sitting on the swing. Compare the time period of the swing measured in different cases. What conclusions do you draw from this activity?
Answer:
Solution to Extended Learning Problem 4
Solutions to In Text Questions of NCERT Class 7 Science Chapter 9 Motion and Time:
1. (Page 92) Table 9.1 gives some common examples of motions. Identify the type of motion in each case.
Table 9.1 Some examples of different types of motion
| Example of motion | Type of motion Along a straight line/circular/periodic |
| Soldiers in a march past | |
| Bullock cart moving on a straight road | |
| Hands of an athlete in a race | |
| Pedal of a bicycle in motion | |
| Motion of the Earth around the Sun | |
| Motion of a swing | |
| Motion of a pendulum |
Answer: The completed table is shown below:
| Example of motion | Type of motion Along a straight line/circular/periodic |
| Soldiers in a march past | Straight Line (Rectilinear) |
| Bullock cart moving on a straight road | Straight Line (Rectilinear) |
| Hands of an athlete in a race | Periodic |
| Pedal of a bicycle in motion | Circular |
| Motion of the Earth around the Sun | Circular/Periodic |
| Motion of a swing | Periodic |
| Motion of a pendulum | Periodic |
2. (Page 92) Make a list of ten objects moving along a straight path. Group the motion of these objects as slow and fast. How did you decide which object is moving slow and which one is moving fast?
Answer: A list of ten objects moving along a straight path are:
| Objects | Motion (Slow/Fast) |
| Snail | Slow |
| Ant | Slow |
| Car | Fast |
| Rocket | Fast |
| Person Walking | Slow |
| Deer | Fast |
| Plane | Fast |
| Train | Fast |
| Worm | Slow |
| Horse | Fast |
If an object covers a huge distance in a given time period, then it is moving fast. If an object covers a smaller distance in a given time period, then it is moving slow.
You can also say that an object which takes less time to cover a certain distance is faster than an object which takes more time to cover the same distance.
3. (Page 92) Suppose you start pedalling your bicycle at the same time as the bus begins to move. The distance covered by you after 5 minutes would be much smaller than that covered by the bus. Would you say that the bus is moving faster than the bicycle?
Answer: Since the bus covers a greater distance than you on your bicycle in the same 5 minutes, we can say that the bus is moving faster than the bicycle.
4. (Page 94) In Class VI you learnt how to measure distances. But, how do we measure time?
Answer:
We can measure time using a time measuring device such as a clock.
5. (Page 94) Have you ever wondered how clocks and watches measure time?
Answer:
All clocks use periodic motion to measure time.
- Traditional mechanical clocks use objects like pendulums or balance wheels which oscillate periodically. This helps the clock hands to move which tells the time.
- The source of the time telling mechanism in quartz clocks is a quartz crystal which oscillates on application of electricity.
6. (Page 96) What would be the basic unit of speed?
Answer:
Since Speed = Distance/Time , the basic unit of speed is m/s.
7. (Page 96) Boojho is wondering how many seconds there are in a day and how many hours in a year. Can you help him?
Answer:
We know: 1 day has 24 hours, 1 hour has 60 minutes, 1 minute has 60 seconds. Therefore, the number of seconds in a day = 24 × 60 × 60 = 86400 seconds. Also, 1 year has 365 days. Therefore, number of hours in a year = 365 × 24 = 8760 hours.
8. (Page 97) How small or large is a time interval of one second?
Answer:
The time taken in saying “two thousand and one” aloud is around one second.
9. (Page 97) Paheli wondered how time was measured when pendulum clocks were not available?
Answer:
Simple but effective devices such as sundials, obelisks (which act like sundials), hourglasses or sand clocks, water clocks, incense clocks, candle clocks etc were used to measure time in various parts of the ancient world when pendulum clocks were not available.
10. (Page 99) Speeds of some living organisms are given in Table 9.4, in km/h. You can calculate the speeds in m/s yourself.
Table 9.4 Fastest speed that some animals can attain
| S. No. | Name of the object | Speed in km/h | Speed in m/s |
| 1. | Falcon | 320 | (320 × 1000 )/(60 × 60) =88.89 |
| 2. | Cheetah | 112 | |
| 3. | Blue fish | 40 – 46 | |
| 4. | Rabbit | 56 | |
| 5. | Squirrel | 19 | |
| 6. | Domestic mouse | 11 | |
| 7. | Human | 40 | |
| 8. | Giant tortoise | 0.27 | |
| 9. | Snail | 0.05 |
Answer: The completed table is shown below:
| S. No. | Name of the object | Speed in km/h | Speed in m/s |
| 1. | Falcon | 320 | (320 × 1000 )/(60 × 60) =88.89 |
| 2. | Cheetah | 112 | (112 × 1000 )/(60 × 60) = 31.11 |
| 3. | Blue fish | 40 – 46 | ( 40 × 1000 )/(60 × 60) = 11.11, ( 46 × 1000 )/(60 × 60) = 12.78 Speed = 11.11 – 12.78 (Range) |
| 4. | Rabbit | 56 | (56 × 1000 )/(60 × 60) = 15.56 |
| 5. | Squirrel | 19 | (19 × 1000 )/(60 × 60) = 5.28 |
| 6. | Domestic mouse | 11 | (11 × 1000 )/(60 × 60) = 3.06 |
| 7. | Human | 40 | (40 × 1000 )/(60 × 60) = 11.11 |
| 8. | Giant tortoise | 0.27 | (0.27 × 1000 )/(60 × 60) = 0.075 |
| 9. | Snail | 0.05 | (0.05× 1000 )/(60 × 60) = 0.014 |
11. (Page 99) Rockets, launching satellites into earth’s orbit, often attain speeds up to 8 km/s. On the other hand, a tortoise can move only with a speed of 8 cm/s. Can you calculate how fast is the rocket compared with the tortoise?
Answer: Speed of rocket = 8 km/s= 8 × 1000 m/s = 8000 m/s.
Speed of tortoise = 8 cm/s = 8/100 m/s.
(Speed of rocket )/(Speed of tortoise ) = 8000/(8/100) = 8000 × 100/8 = 100,000
Therefore, the rocket is 100,000 times or 105 times faster than the tortoise.
12. (Page 99) Boojho wants to know whether there is any device that measures the speed?
Answer:
The device that measures the speed is called speedometer. It is fitted on top of a scooter or a motorcycle and located in front of the driver’s seat on the dashboards of vehicles like car, buses etc. The speedometer records the speed in km/h.
13. (Page 100) While going for a school picnic, Paheli decided to note the reading on the odometer of the bus after every 30 minutes till the end of the journey. Later on she recorded her readings in Table 9.5. Can you tell how far was the picnic spot from the school? Can you calculate the speed of the bus?
Table 9.5 Odometer reading at different times of the journey
| Time (AM) | Odometer reading | Distance from the starting point |
| 8:00 AM | 36540 km | 0 km |
| 8:30 AM | 36560 km | 20 km |
| 9:00 AM | 36580 km | 40 km |
| 9:30 AM | 36600 km | 60 km |
| 10:00 AM | 36620 km | 80 km |
Answers:
Can you tell how far was the picnic spot from the school?
We find the total distance by subtracting the final odometer reading from the initial odometer reading. So, the total distance between the picnic spot and the school = (36620 – 36540) km = 80 km.
Can you calculate the speed of the bus? We see from the table that the bus covers 20 km every 30 mins, so speed of the bus is constant. The bus covers the total distance of 80 km in (10 AM – 8 AM) = 2 hours. So, speed of the bus = (Total Distance)/(Total Time) = (80 km)/(2 hours) = 40 km/hr.
Therefore, the picnic spot is 80 km far from the school and the speed of the bus is calculated as 40 km/hr.
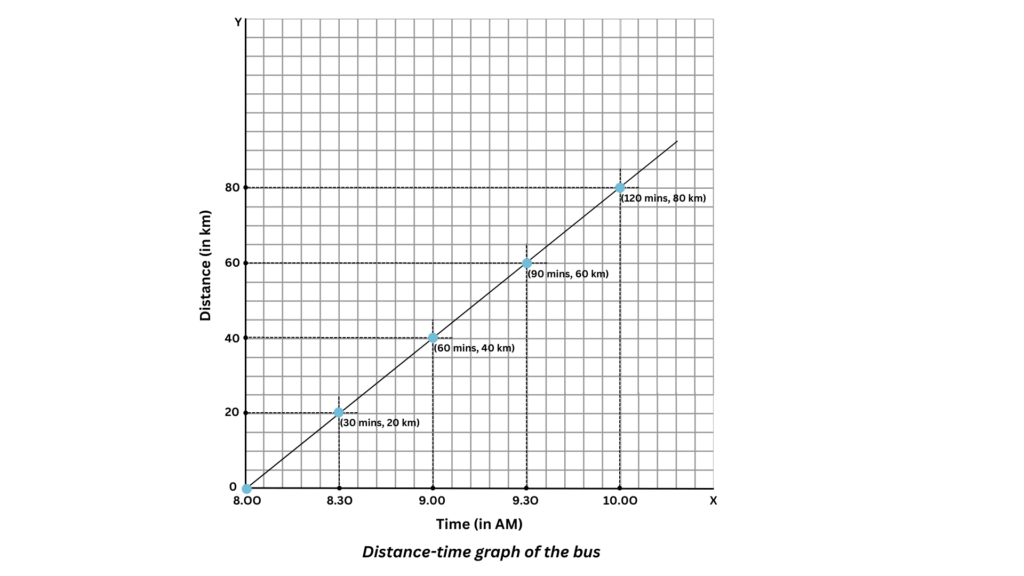
14. (Page 100 and 104) Looking at the Table 9.5, Boojho asked Paheli whether she can tell how far they would have travelled till 9:45 AM. Paheli had no answer to this question. They went to their teacher. She told them that one way to solve this problem is to plot a distance-time graph.
Suppose we want to know how much distance the bus had travelled at 8:15 AM. How much is this distance in km?
Can you now help Paheli to find the distance moved by the bus at 9:45 AM?
Can you also find the speed of the bus from its distance-time graph?
Answer:
The required table is shown below:
Table 9.5 Odometer reading at different times of the journey
| Time (AM) | Odometer reading | Distance from the starting point |
| 8:00 AM | 36540 km | 0 km |
| 8:30 AM | 36560 km | 20 km |
| 9:00 AM | 36580 km | 40 km |
| 9:30 AM | 36600 km | 60 km |
| 10:00 AM | 36620 km | 80 km |
Plotting the distance-time graph:
- Take a graph paper of 25 cm × 25 cm and let the x-axis represent time (in AM) and the y-axis represent distance (in km).
- Choose the following scale for distance: 5 km = 1 cm and choose the following scale for time: 6 min = 1 cm.
- Using the scale for time: 6 min = 1 cm we get the following table:
| Time (AM) | Time passed (in minutes) | Number of Units (in cm) |
| 8:00 AM | 0 | 0 |
| 8:30 AM | 30 | 5 |
| 9:00 AM | 60 | 10 |
| 9:30 AM | 90 | 15 |
| 10:00 AM | 120 | 20 |
- Using the scale for distance: 5 km = 1 cm we get the following table:
| Distance (in km) | Number of Units (in cm) |
| 0 | 0 |
| 20 | 4 |
| 40 | 8 |
| 60 | 12 |
| 80 | 16 |
- Now count the units (shown in the two tables above) and mark the points on the 25 cm × 25 cm graph paper to represent each set of values for distance and time.
- Initially at 8.00 AM (time passed = 0 minutes), the distance covered is 0. Therefore, the point corresponding to this set of values on the graph will the origin itself. Mark the origin on the paper.
- At 8:30 AM (time passed = 30 minutes), the distance covered is 20 km. From the table we see that 30 minutes is equivalent to 5 units on the graph paper. Count 5 units on the x-axis and draw a line parallel to the y-axis at this point. Also, 20 km is equivalent to 4 units on the graph paper. Count 4 units on the y-axis and draw a line parallel to the x-axis at this point. The point where these two lines intersect represents this set of values on the graph.
- Similarly mark on the graph paper the points corresponding to different sets of values.
The complete distance-time graph of the bus is shown below:
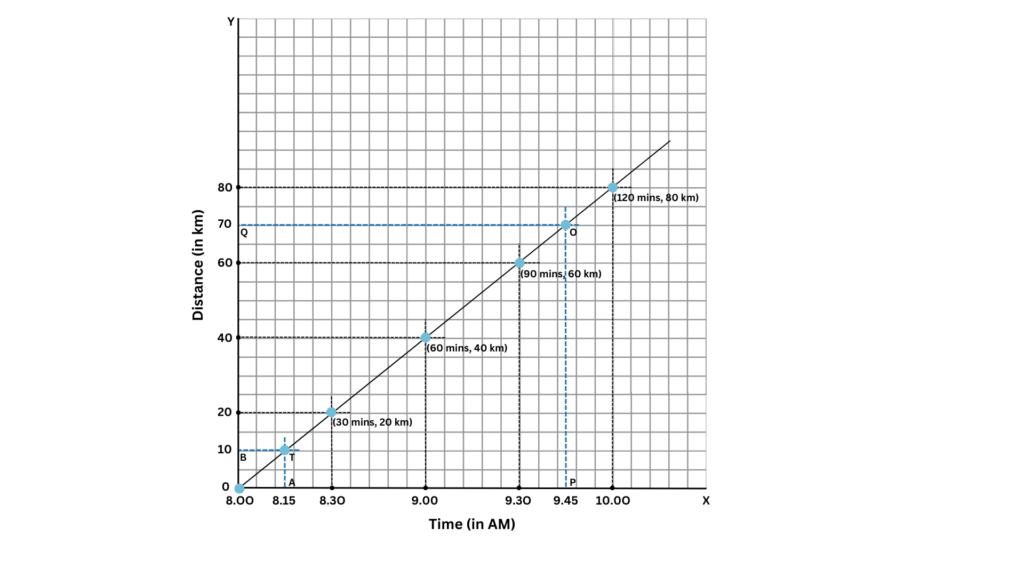
Suppose we want to know how much distance the bus had travelled at 8:15 AM. How much is this distance in km?
- We mark the point A corresponding to the time (8:15 AM) on the x-axis.
- Draw a line perpendicular to the x-axis (or parallel to the y-axis) through A which intersects the graph at T.
- Next draw a line through the point T parallel to the x-axis which intersects the y-axis at point B.
- Therefore, the distance travelled by the busat 8:15 AM = OB = 10 km.
Can you now help Paheli to find the distance moved by the bus at 9:45 AM?
- We mark the point P corresponding to the time (9:45 AM) on the x-axis.
- Draw a line perpendicular to the x-axis (or parallel to the y-axis) through P which intersects the graph at O.
- Next draw a line through the point O parallel to the x-axis which intersects the y-axis at point Q.
- Therefore, the distance travelled by the bus at 9:45 AM = OQ = 70 km.
Both the calculations are shown in the graph below:
Can you also find the speed of the bus from its distance-time graph?
Refer to the graph below:
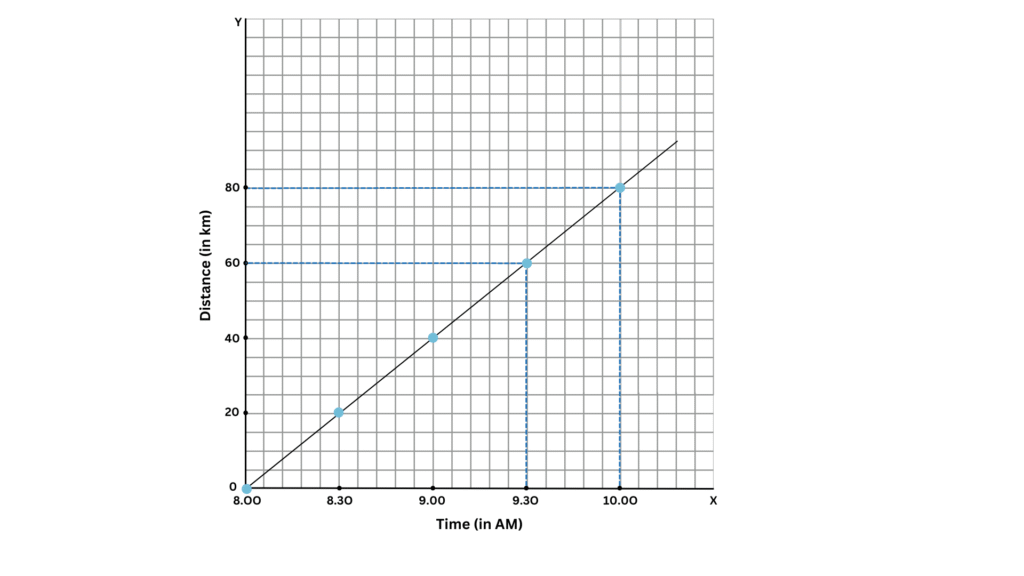
We see from the table that the bus covers 20 km every 30 mins, so the graph is a straight line and the speed of the bus is constant.
To calculate the speed of the bus we take any two points on the graph as shown above. Through each point draw a line perpendicular to the x-axis and a line perpendicular to the y-axis.
For the first point the line perpendicular to the x-axis gives you the time at that particular point in the journey of the bus and the line perpendicular to the y-axis gives you the distance covered for that time.
Similarly, you can find the time and the corresponding distance covered for the second point in the journey of the bus.
For our chosen points on the graph, we can see that at 9:30 AM the distance covered was 60 km and at 10.00 AM the distance covered was 80 km.
Therefore, the bus covers (80 – 60) km = 20 km in (10.00 AM – 9:30 AM) mins = 30 minutes = 30/60 = 0.5 hr. Also, speed of the bus = (Distance )/Time = (20 km )/(0.5 hr) = 40 km/hr.
Solutions to All Activities of NCERT Class 7 Science Chapter 9 Motion and Time:
1. Complete Activity 9.1 (Page 82). Look at Fig. 9.1. It shows the position of some vehicles moving on a road in the same direction at some instant of time. Now look at Fig. 9.2. It shows the position of the same vehicles after some time. From your observation of the two figures, answer the following questions: Which vehicles is moving the fastest of all? Which one of them is moving the slowest of all?
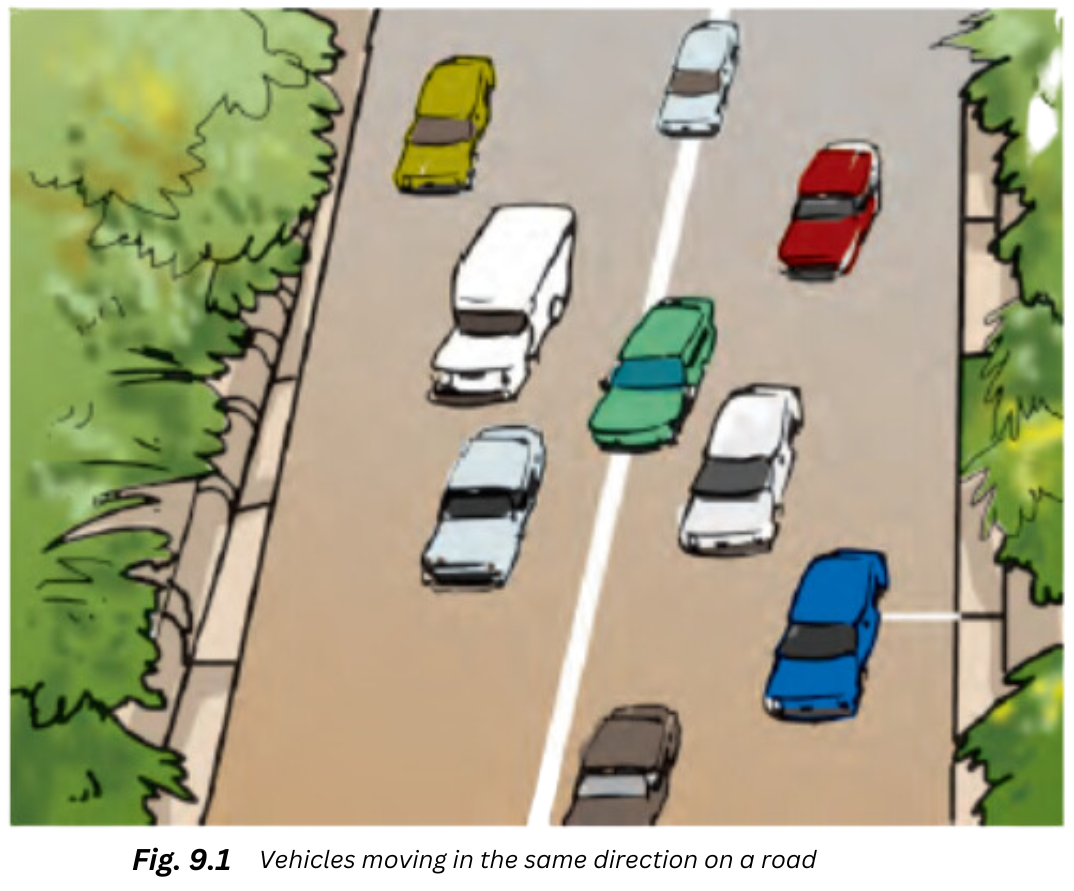
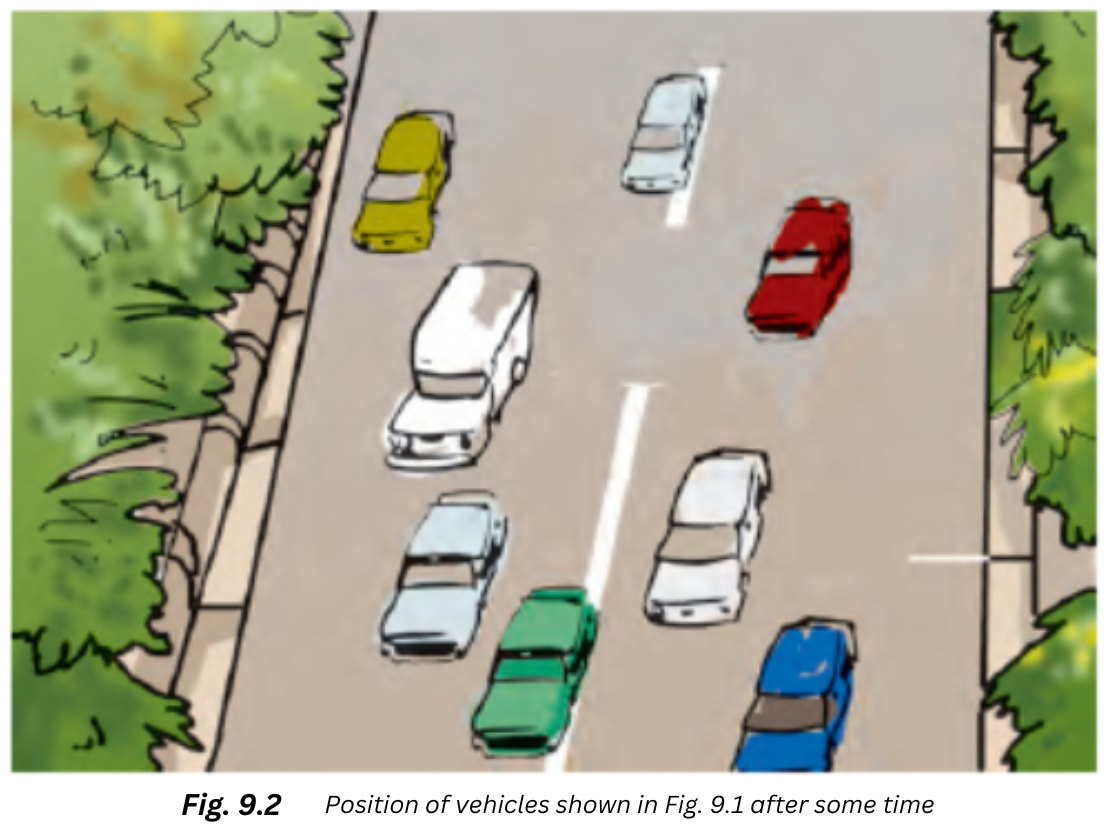
Answer:
2. Complete Activity 9.2 (Page 95). Set up a simple pendulum as shown in Fig. 9.4 (a) with a thread or string of length nearly one metre. Switch off any fans nearby. Let the bob of the pendulum come to rest at its mean position. Mark the mean position of the bob on the floor below it or on the wall behind it.
To measure the time period of the pendulum we will need a stopwatch. However, if a stopwatch is not available, a table clock or a wristwatch can be used.
To set the pendulum in motion, gently hold the bob and move it slightly to one side. Make sure that the string attached to the bob is taut while you displace it. Now release the bob from its displaced position. Remember that the bob is not to be pushed when it is released. Note the time on the clock when the bob is at its mean position. Instead of the mean position you may note the time when the bob is at one of its extreme positions. Measure the time the pendulum takes to complete 20 oscillations. Record your observations in Table 9.2. The first observation shown is just a sample. Your observations could be different from this. Repeat this activity a few times and record your observations. By dividing the time taken for 20 oscillations by 20, get the time taken for one oscillation, or the time period of the pendulum.
Is the time period of your pendulum nearly the same in all cases?
Answer:
3. Complete Activity 9.3 (Page 97). Draw a straight line on the ground with chalk powder or lime and ask one of your friends to stand 1 to 2 m away from it. Let your friend gently roll a ball along the ground in a direction perpendicular to the line. Note the time at the moment the ball crosses the line and also when it comes to rest (Fig. 9.6). How much time does the ball take to come to rest? Measure the distance between the point at which the ball crosses the line and the point where it comes to rest. You can use a scale or a measuring tape. Let different groups repeat the activity. Record the measurements in Table 9.3. In each case calculate the speed of the ball.
Answer:
Extra Questions to Complement Solutions to NCERT Class 7 Science Chapter 9 Motion and Time:
Very short answer type questions:
1. A bicycle is rolling down a slope and no brakes are applied. What kind of motion is this?
Answer:
The bicycle rolls freely down the slope since no brakes are applied and its speed keeps increasing. Hence, this is an example of non-uniform motion.
2. Name one factor that the time period of a given pendulum depends on.
Answer:
The time period of a given pendulum depends on length.
3. Name the scientist that discovered that the time period of a given pendulum is constant.
Answer:
Galileo Galilie (A.D 1564 – 1642) discovered that the time period of a given pendulum is constant.
4. Calculate the number of minutes in a leap year.
Answer:
A leap year has 366 days. 1 day = 24 hours and 1 hour = 60 minutes. Therefore, the number of minutes in leap year = 366 × 24 × 60 = 527,040 minutes.
5. To express distance should you write 100 km or 100 kms?
Answer:
We should write 100 km because by convention the symbols of all units are written as singular.
6. What is the SI unit of speed?
Answer:
The SI unit of speed is m/s.
7. What does the unit ‘m/min’ represent?
Answer:
The unit ‘m/min’ represents speed.
8. Why cannot you use an ordinary clock to measure time in scientific research?
Answer:
The smallest time that an ordinary clock can measure is one second, while scientific research requires us to measure time intervals as small as ‘one millionth’ or ‘one billionth’ of a second.
9. Should you express the time taken by you to go back and forth between your home and school in years?
Answer:
No, in this case ‘minutes’ would be more convenient to use than ‘years’ to help us understand how long it takes to cover the distance between home and school.
10. You learnt about clocks in this chapter. What type of motion is being performed by the hands of a clock?
Answer:
Both circular and periodic. The hands of a clock move in a circle, so the motion is circular. This circular motion is repeated after fixed intervals of time, so the motion is also periodic.
11. How do you measure time taken for an event with a stopwatch?
Answer:
You start the stopwatch right when the event starts and stop it right when the event ends. The reading on the stopwatch will give you the time taken for the event to get completed.
12. Why is it convenient to express the speed of a plane in km/hr instead of m/s?
Answer:
Planes move very fast and cover a huge distance in a given amount of time. Hence, km/hris a practical and convenient unit to help us understand the speed of the plane.
Short answer type questions:
1. Give one similarity between ancient clocks and modern clocks.
Answer:
Both ancient and modern clocks make use of some type of periodic motion. Ancient clocks use periodic motions such as the swinging of a pendulum and modern clocks use a quartz crystal which vibrate periodically when an electric current is applied.
2. A car drives in a circular road and then drives along a straight road of the same length in the same time. What can you say about the speed of the car in both cases?
Answer:
The distance of the circular road = the distance of the straight road.
Time to cover the circular road = time to cover the straight road.
The speed of the car = Distance/Time and the distance and time being the same in both cases, we can say the speed is the same in both cases.
3. Two cars are travelling in two different directions. Can they have the same speed?
Answer:
Yes, the magnitude of speed does not depend on the direction. Speed = Distance/Time and so if the car covers the same distance in the same time in both directions, the speed of the car will be the same.
4. A car covers the first 2 km of its journey in 10 minutes, the next 2 km in 12 minutes and the next 2 km in 10 minutes. What can you say about the speed of the car?
Answer:
The car takes 10 minutes to cover the first 2 km, 12 minutes to cover the next 2 km and again takes 10 minutes to cover the last 2 km. Since it takes more time to cover the 2 km distance in the middle, we can say that the speed of the car decreases during the middle interval. Therefore, the speed of the car is non-uniform.
5. Why is a line graph used instead of a bar graph for representing a distance-time graph?
Answer:
A line graph is used because:
- It is better suited for observing small changes in distance over time.
- The line graph also enables us to find the distance moved by the bus at any instant of time, which cannot be done using a bar graph.
6. Why is a pie chart not suitable instead of a line graph to represent motion of a car?
Answer:
Pie charts only show percentages of a whole and is not a continuous representation of data. Hence it is impossible to track the changes in distance over time.
7. Paheli and Boojho have to cover different distances to reach their school but they take the same time to reach the school. What can you say about their speed? (NCERT Exemplar)
Answer:
The distances covered by Paheli and Boojho are different although the time taken is same. Since speed = Distance/Time , we can say that their speeds are different since the magnitudes of the distances covered by them are different. The one who covers more distance in the given time has greater speed.
8. If Boojho covers a certain distance in one hour and Paheli covers the same distance in two hours, who travels in a higher speed? (NCERT Exemplar)
Answer:
Boojho travels with a higher speed because he covers the same distance in lesser time than Paheli. Mathematically, speed = Distance/Time and a lesser denominator will give a greater magnitude if the numerator is the same. Since Boojho takes lesser time to cover the same distance, his speed will be higher.
9. A simple pendulum below without any disturbance. O is the mean position and A and B are the two extreme positions. Do you notice anything wrong with the figure?
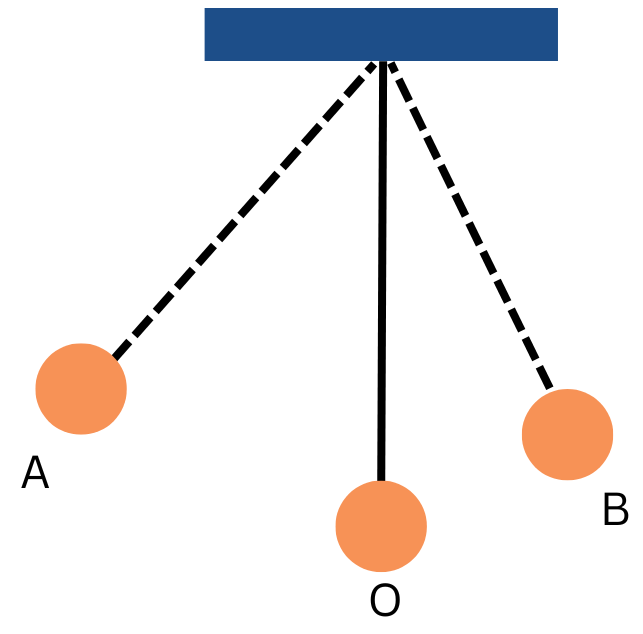
Answer:
The above simple pendulum cannot exist. The oscillating simple pendulum should get equally displaced on both sides of the mean position. In the above case it gets displaced more to the left than to the right and there is no disturbance involved, which is not possible.
Long answer type questions:
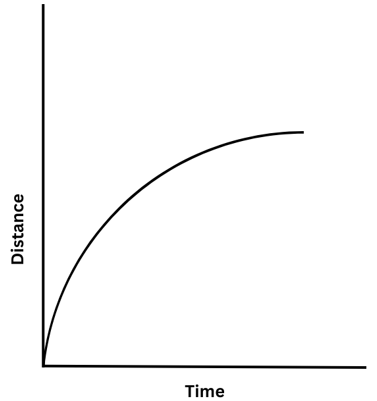
1. Shown below is the distance-time graph for the motion of a car along a straight line. Is the motion uniform or non-uniform?
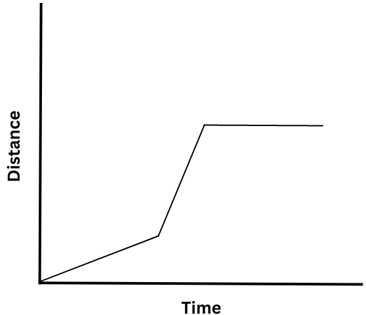
Answer: Divide the car’s journey into three different time periods as shown below:
For the time period t1 the car moves with constant speed since that part of the distance-time graph is a straight line. The corresponding distance covered is d1.
For the time period (t2 – t1) the car also moves with constant speed, however it covers a greater distance (d2 – d1) in a smaller time (t2 – t1). So, the speed of the car is greater in this time period than the first one.
For the time period (t3 – t2) the distance covered does not change, which means that the car is at rest.
Thus, for the overall period the speed of the car is not constant and the motion is non-uniform.
2. Look at the distance-time graph below for the motion of a car. What can you say about the speed of the car?
Answer:
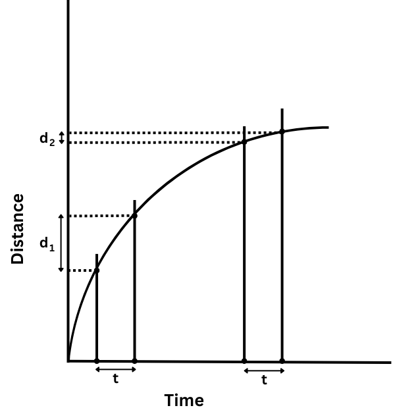
Let us choose two time periods of equal length ‘t’ as shown in the graph above. You can use a ruler for this. Mark the end points of the two time periods.
From the end points of the first time period of length ‘t’ draw perpendicular lines which intersect the graph at two points as shown above. Now, from the points of intersections draw two horizontal lines which meet the distance-axis at two points. As you can see the distance covered in the first time period ‘t’ is d1.
Similarly, from the end points of the second time period of length ‘t’ draw perpendicular lines which intersect the graph at two points. Then, from the points of intersections draw two more horizontal lines which meet the distance-axis at two points. As you can see the distance covered in the second time period ‘t’ is d2.
It is easy to see from the graph that d1 > d2.
So, a greater distance d1 is covered in the first time period of length ‘t’ and a smaller distance d2 is covered in the second time period of equal length ‘t’.
So, we conclude that the speed of the car is not constant and was greater in the beginning and then decreased later.
3. Look the distance-time graphs for a car shown below. What do they indicate? Are these graphs possible?
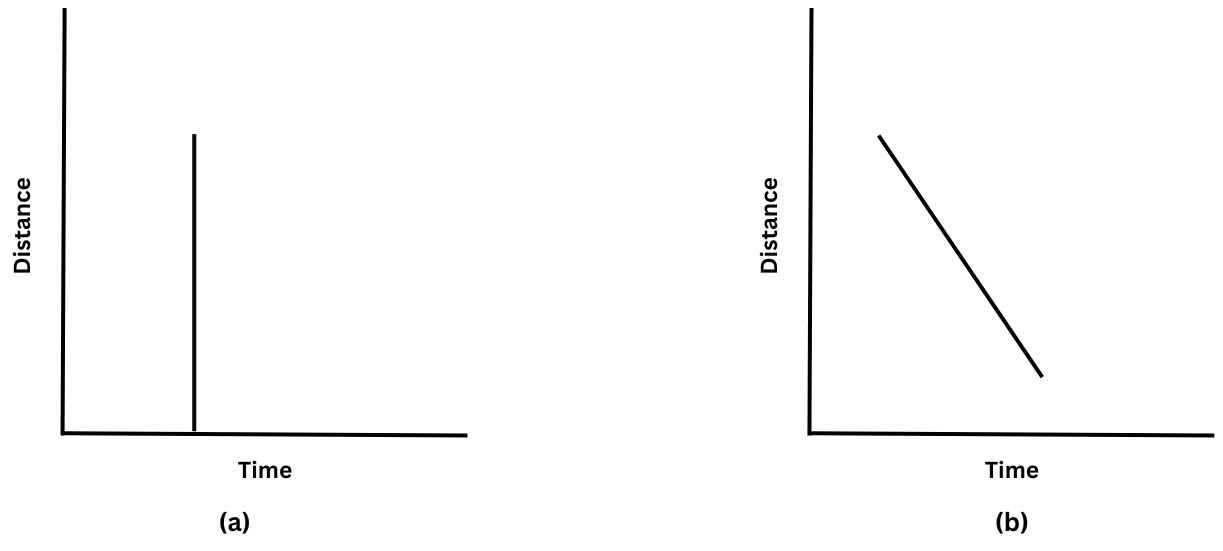
Answer: In graph (a) the straight line perpendicular to the time-axis and parallel to the y-axis means that different distances are covered at the exact same time. This is physically impossible and so graph (a) cannot exist.
Graph (b) indicates that the total distance covered by the car decreases with time. This is also physically impossible and so graph (b) cannot exist.
Fill in the Blanks:
shorter, 12, obelisks, clepsydra, length, larger
(a) Higher speed seems to indicate that a given distance has been covered in a _________ time or a _________ distance has been covered in a given time.
(b) The time period of a pendulum depends on the _________ of the pendulum.
(c) A _________ was used in ancient times to measure time using water.
(d) Your pulse rate beats about _________ in 10 seconds.
(e) _________ were used as sundials in ancient Egypt.
Answers:
(a) Higher speed seems to indicate that a given distance has been covered in a shorter time or a larger distance has been covered in a given time.
(b) The time period of a pendulum depends on the length of the pendulum.
(c) A clepsydra was used in ancient times to measure time using water.
(d) You pulse rate beats about 12 in 10 seconds.
(e) Obelisks were used as sundials in ancient Egypt.
Match and Pair:
1. Match the items of Column I with suitable items in Column II:
| Column I | Column II |
| (a) Uniform motion | (i) Distance |
| (b) Odometer | (ii) Jantar Mantar |
| (c) Sundial | (iii) Time keeping services |
| (d) National Physical Laboratory | (iv) Non-uniform motion |
| (e) Curved distance-time graph | (v) Constant speed |
Answer: The correct table is shown below:
| Column I | Column II |
| (a) Uniform motion | (v) Constant speed |
| (b) Odometer | (i) Distance |
| (c) Sundial | (ii) Jantar Mantar |
| (d) National Physical Laboratory | (iii) Time keeping services |
| (e) Curved distance-time graph | (iv) Non-uniform motion |
++++++++++++++
Frequently Asked Questions (FAQs) on NCERT Solutions to Class 7 Science Chapter 9 Motion and Time:
Our expert team of Indian and foreign-educated teachers, engineers and scientists have taken a comprehensive approach in answering all questions and doubts that students may have from this chapter. In addition to explaining all the exercise questions, extended learning activities, in-text questions and activities, we have also included concept-based extra questions to further help you prepare. These resemble exam questions and will teach you to apply yourself to solve similar known problems. We have also included excellent pictures wherever possible – learn and enjoy!
The free PDFs of the solutions are available for download anytime! If you found our study material helpful and want more, keep visiting our website and subscribe to our email list. It just takes one click to subscribe and you will be among the first to receive all the free resources that we are preparing for you!
The following topics are covered:
9.1 – Slow or Fast
9.2 – Speed
9.3 – Measurement of Time
Units of Time and Speed
9.4 – Measuring Speed
9.5 – Distance-Time Graph
Here are the number of problems for the chapter:
(i) 1 Classification Type Question (Question 1)
(ii) 1 Correct/Incorrect Statement Type Question (Questions 2)
(iii) 5 Numerical Questions (Questions 3, 4, 5, 6, 11)
(iv) 1 Graph Drawing Question (Question 7)
(v) 4 Multiple Choice Questions (Question 8, 9, 10, 11)
(vi) 1 Graph Interpretation Question (Question 12)
Of course! You can download the PDF versions of educationroundtheworld.com’s NCERT Solutions for Class 7 Science Chapter 9 Motion and Time anytime! All the different types of extra questions we have designed are also included in the PDF version! Please look towards the top of the page to find the download button!
Start by understanding the concepts of speed and time and how to measure these quantities. The second and most important part of the chapter is about the distance-time graph. We recommend you start by understanding how to draw a distance-time graph from scratch, which we have explained very clearly in the solutions to the ‘In Text’ questions. Then prepare yourself to answer conceptual questions based on the distance-time graph. We have designed some typical questions for your benefit, which would be an excellent place to begin. We also encourage you to study the images and graphs we have included carefully while studying. They include real-life applications of what you have learnt and we are sure you will find them interesting.
We understand that every student’s requirements are different and would love to prepare you in the way that suits you the best! So, in case you need additional help, please feel free to contact us with your requirements anytime and let us help you out!
Good training and mentoring using the right methods can make a world of difference in your studies and future career. In additional to exam preparation, our expert teachers also mentor students and help them discover their interests and where their true talents lie. This approach helps students realise their maximum potential.
We provide expert one-on-one coaching and mentoring to you depending on your convenience and needs – have it completely your way! Feel free to contact us with your requirements anytime and we’ll be happy to help you out! Book any number of appointments now! (Insert hyperlink)