Hello, dear students!
Welcome to an exciting exploration of the chapter “Understanding the Weather.” Our team of passionate educators—trained both in India and abroad—has carefully crafted these solutions to be easy to understand, engaging, and enjoyable to read. We’ve answered every question and activity in the chapter to support your learning and boost your confidence.
Always remember, learning is an adventure—and we’re right here with you, ready to support and encourage you every step of the way!
Looking for more guidance? We offer top-quality coaching designed to spark your interest in social science and help you excel in any exam. Reach out with your learning goals, and we’ll be delighted to assist you!
Solutions to NCERT Class 7 Social Science Exploring Society: India and Beyond Chapter 2 Understanding the Weather
The Big Questions
1. How can we measure and monitor the weather around us?
Answer:
We can measure and monitor the weather around us by using different tools to measure things like temperature, wind, rain, and humidity:
A thermometer tells us how hot or cold it is.
A barometer shows the air pressure.
An anemometer measures how fast the wind is blowing.
A wind vane shows the direction the wind is coming from.
A hygrometer checks how much water vapour is in the air.
A rain gauge collects and measures how much it rains.
These tools are often kept together at weather stations. Some weather stations work on their own using sensors—these are called automated weather stations. Weather scientists, also known as meteorologists, use the information from these tools to predict the weather.
2. How do weather predictions help us prepare for events like heavy rain, storms, drought and heat waves?
Answer:
Weather predictions by meteorologists help us prepare for events like heavy rain, storms, droughts, and heat waves by giving early warnings so that people take necessary counter measures to stay safe.
For example, if a cyclone is predicted, fishermen can avoid going out to sea, and people living in coastal areas can be evacuated in time to safer areas.
If heavy rain is expected, local authorities can warn people about floods, close schools, and prepare rescue teams.
In case of a heat wave, people can be advised to stay indoors, drink plenty of water, and avoid going out during the hottest hours.
If a drought is predicted, farmers can plan water use carefully or switch to crops that need less water.
Weather forecasts also help in air travel by warning pilots about strong winds or storms, and they are used to cancel or delay trains and flights for safety.
Overall, weather predictions help governments, farmers, travellers, and the general public to make better decisions and avoid harm.
LET’S EXPLORE (Page 28)
What are some of the words in your local language that you use to describe the weather? Hot, cold, warm, chilly, crisp, pleasant, and so on, are commonly used terms in English.
Answer:
In my local language which is Hindi, we use different words to describe the weather:
| English words to describe the weather | Hindi words to describe the weather |
| Hot | garmi |
| warm | gunguna Mausam, halki garmi |
| cold | thandi |
| pleasant | sukhad Mausam, achchha mausam |
| chilly | siharan bhari ṭhanḍ, ṭhiṭhuran |
| crisp | khushgawar ṭhanḍ, tazgi bhari ṭhanḍ |
| very hot | bhiṣaṇ garmi |
| windy | tez hawa |
| cool breeze | ṭhanḍi hawa |
These words help us describe the feel of the weather in everyday conversation.
THINK ABOUT IT (Page 29)
Let us imagine that Krishnan from Chennai is speaking with Amir in Kashmir. Krishnan tells Amir that it has become chilly in Chennai after it rained the previous night. Amir asks him how cold it is. How will Krishnan explain to Amir how cold it is? After all, what is cold for Krishnan may be quite pleasant for Amir!
Answer:
The following conversation between Krishnan from Chennai and Amir in Kashmir reveals how best Krishnan can explain to Amir just how cold it is:
Krishnan: Hey Amir! It rained last night in Chennai, and now the weather has become quite chilly!
Amir: Chilly? Really? How cold is it?
Krishnan: It’s about 22 degrees Celsius. For us, that’s pretty cold! I even wore a pullover this morning.
Amir (laughs): 22 degrees? That sounds like a pleasant spring day here in Kashmir! We call that warm!
Krishnan: Haha, I knew you’d say that! In Chennai, we are used to an average temperature of around 37 degrees in summer, so we are feeling cold!
We see that Krishnan can only explain to Amir just how cold it is by telling him the actual ambient temperature in Chennai (i.e. 22 degrees Celsius) because the terms ‘cold’ or ‘warm’ as we can see are relative. What feels ‘cold’ to Krishnan, seems ‘warm’ to Amir who is used to much lower temperatures.
LET’S EXPLORE (Page 29)
What do you think could be some other reasons to measure the weather more precisely? (Hint: Think how knowing the weather a few hours or a few days in advance would help you plan some activities.)
Answer:
Some other reasons to measure the weather more precisely which can help us in many everyday situations are:
1. Planning outdoor events – For example, if advance notice of bad weather is received, schools or communities can decide whether to hold a sports day, picnic, or wedding outdoors or move it indoors. They may even postpone the event till the weather becomes more favourable.
2. Travel safety – People can avoid driving on slippery roads during fog or icy weather, or change travel plans if a storm is coming.
3. Construction work – Builders need dry, stable weather to pour concrete on rooftops or paint outer walls of buildings, so prior knowledge of the upcoming weather helps them plan and schedule work efficiently.
4. Energy usage – Power companies can gear up for higher electricity demand during very hot or cold days.
5. Health reasons – People with asthma or allergies might need to be careful and take extra precautions if the weather is dusty, windy, or humid.
LET’S EXPLORE (Page 30)
Talk to elders in your neighbourhood and ask them how they predict the weather. What signs do they observe? Document any sayings in your regional language that refer to weather prediction.
Answer:
I spoke with some elders in my neighbourhood to find out how they predicted the weather before the advent of the modern instruments.
From them I learned that they observed nature very minutely and relied on some signs to predict the weather. Knowledge of these signs were passed down from one generation to another. Some of the signs are discussed below:
When birds fly low, it indicates the advent of bad weather.
When ants march in a straight line or build small anthills, it is a sign of imminent rain.
Dark clouds approaching from the west signify the advent of rain.
If the wind blows from the south, the rain is not far behind.
A red sky at sunset means it will rain the next day.
If ants start bringing out their eggs, they indicate that rain is on the way.
Frogs croaking loudly indicate rain.
These sayings reflect how closely people observed animals, insects, winds, clouds, and the sky to understand the weather.
Don’t Miss Out (Page32)
Can you think of a reason why rain arises from the sun?
Answer:
We can say that the rain arises from the sun because the sun rays heat up water in rivers, lakes, and oceans, causing it to evaporate and turn into water vapor. This vapor rises into the sky, cools down, and forms clouds. When the clouds become heavy with water droplets, they fall back to the ground as rain. So, the sun plays an important role in causing rain.
LET’S EXPLORE (Page 32)
Here’s a chart of the temperatures of a city in Madhya Pradesh. What is the maximum temperature recorded in the week shown here? What is the minimum? Calculate the range.
| Date | Maximum Temperature (in ℃) | Minimum Temperature (in ℃) |
| 28.02.2025 | 29 | 16 |
| 01.03.2025 | 30 | 15 |
| 02.03.2025 | 31 | 17 |
| 03.03.2025 | 32 | 18 |
| 04.03.2025 | 30 | 17 |
| 05.03.2025 | 28 | 14 |
| 06.03.2025 | 29 | 15 |
Answer:
Maximum temperature: 32°C
Minimum temperature: 14°C
Range of Temperature = Maximum temperature – Minimum temperature
32°C – 14°C
= 18°C
Remember the conversation between Krishnan and Amir? If Krishnan said it was 20°C in Chennai and he was feeling a little cold, he and Amir would have a measure they could understand. What do you think Amir’s reaction to Krishnan’s statement might be?
Answer:
Since Amir lives in Kashmir, where the weather is usually much colder, he might be surprised by what Krishnan said. He could respond by saying, “You feel cold at 20°C? That’s a nice, summer day for us!” For Amir, 20°C might feel just right or even slightly warm, while for Krishnan, who is used to Chennai’s hotter climate, it feels chilly. This shows that people’s ideas of hot and cold can be very different depending on where they live and what weather they are used to.
THINK ABOUT IT (Page 35)
Why do you think it would be important to measure atmospheric pressure? Who are the people most likely to use such measurements?
Answer:
It is important to measure atmospheric pressure because it helps us understand and predict changes in the weather. A sudden drop in pressure can mean a storm or cyclone is coming, while high pressure often indicate clear skies. People who are most likely to use this information include meteorologists(weather scientists), airline pilots, ship captains, farmers, and army personnel in high-altitude areas. It helps them make safe and smart decisions in their work.
THINK ABOUT IT (Page 36)
Have you seen seeds like these flying in the wind? What would happen to the seeds if there was no wind?

Answer:
Yes, some seeds like those of dandelions or cotton float and are carried by the wind. If there was no wind, these seeds would just fall straight to the ground near the parent plant. Without wind, they wouldn’t be able to spread far and grow in new places away from the parent plant. So, the wind helps plants spread to different areas by dispersing their seeds.
LET’S EXPLORE (Page 37)
Where do you think humidity is likely to be more, Kochi or Jaipur? You might guess that Kochi has higher humidity than Jaipur because it is located near the sea. But how will we know for sure? If we had to compare the humidity level between Kochi and Mangaluru, how would we do it? Discuss with your classmates
Answer:
Humidity is likely to be more in Kochi than in Jaipur because Kochi is near the sea, while Jaipur is in a dry, inland area. To make sure, we can use an instrument called a hygrometer to measure the humidity levels.
If we had to compare Kochi and Mangaluru, we would still need to use a hygrometer. Both cities are located on the coast of the Arabian Sea, so they both have high humidity. Comparing their actual readings on the hygrometer will tell us which one has more moisture in the air at a given time.
THINK ABOUT IT (Page 38)
If the humidity in Delhi is at 52% while in Kochi it is 84%, in which of the two places are wet clothes likely to dry faster? And where are you likely to sweat more, assuming the temperature is the same in both places?
Answer:
Wet clothes are likely to dry faster in Delhi because the humidity is lower at 52%, which means the air can absorb more moisture. In Kochi, where the humidity is 84%, the air is already full of moisture, so clothes will take longer to dry.
We are also likely to sweat more in Kochi because high humidity makes it harder for sweat to evaporate so we would also feel hotter and stickier, even if the temperature is the same as in Delhi.
LET’S EXPLORE (Page 41)
Discuss, in pairs, different situations in which weather predictions are helpful. Make a list, and after you have completed it, share it and discuss it with the pair sitting next to you. How many different categories of situations have you been able to identify?
Answer:
Here is a list of situations where weather predictions are helpful:
Travel and Transport – Weather forecasts can help people plan safe journeys by road, rail, air, or sea. For example, flights may be delayed or cancelled due to storms or fog. People may postpone road trips to avoid accidents if there is a forecast of torrential rainfall, sleet or heavy snowfall.
Farming – Farmers benefit from the information about whether it will rain or stay dry so they can plan sowing, irrigation, or harvesting activities.
School and Outdoor Events – Weather forecasts can be instrumental in deciding whether school trips, sports days, or public events should be postponed due to bad weather.
Disaster Preparedness – Early alerts about cyclones, floods, or heatwaves help people stay safe and allow governments to prepare to tackle the situation.
Health and Safety – Advance warnings about heatwaves or cold waves enable people to take precautions to avoid falling sick.
Fishing and Coastal Work – Fishermen benefit from forecasts to decide when it’s safe to go to sea.
Construction Work – Builders check weather to plan their construction schedule because they cannot work outdoors during heavy rains, storms, or snowfall.
LET’S EXPLORE (Page 41)
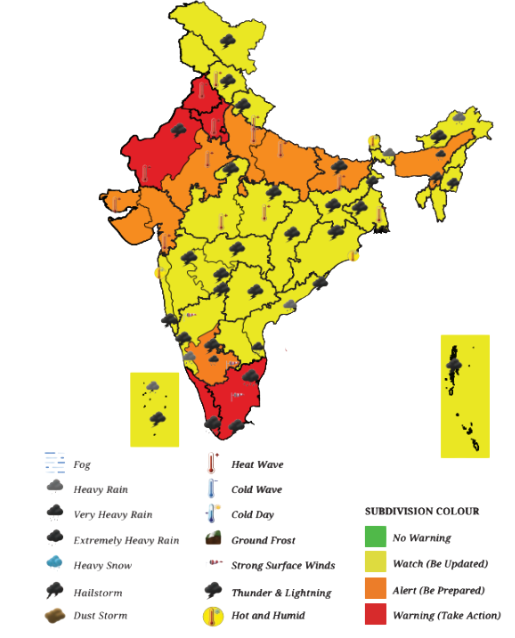
Look carefully at the map of India above. This map was issued by the India Meteorological Department on 19 May 2024. Study the icons and connect them to the conditions shown on the map.
What do you observe happening on that day? What are the various weather conditions that the IMD is alerting people to? Which states have warning signs? Which parts of India are likely to be free from severe weather? Which states are likely to face heat wave conditions? What are the causes for warning in Tripura and Lakshadweep?
Answer:
Weather Conditions Observed on May 19, 2024:
South Peninsular India: Isolated extremely heavy rainfall was observed in Tamil Nadu and Kerala.
Northeast India: Regions including Assam, Meghalaya, Arunachal Pradesh, and Tripura experienced widespread rainfall accompanied by thunderstorms.
Western and Central India: States such as Rajasthan, Punjab, Haryana, Delhi, Uttar Pradesh, Gujarat, and parts of Madhya Pradesh faced severe heatwave conditions, with soaring temperatures.
What are the various weather conditions that the IMD is alerting people to?
Answer:
IMD is alerting people about heat wave conditions and also about heavy rainfall.
Which states have warning signs?
Answer:
Heatwave alerts have been issued for the states of Punjab, Haryana, Delhi, Rajasthan, Uttar Pradesh, Gujarat, Madhya Pradesh, Bihar, Jharkhand, Odisha, West Bengal, and Uttarakhand.
Heavy Rainfall warnings have been issued for the states of Tamil Nadu, Kerala, Karnataka, Andhra Pradesh, Telangana, Lakshadweep, Assam, Meghalaya, Arunachal Pradesh, and Tripura.
Which parts of India are likely to be free from severe weather?
Answer:
Parts of India likely to be free from severe weather are parts of Central India and the Western Himalayan region, including Chhattisgarh, Jharkhand, Himachal Pradesh, and Uttarakhand because no significant weather warnings are indicated for these regions on this day.
Which states are likely to face heat wave conditions?
Answer:
States facing severe heatwave conditions are Rajasthan, Punjab, Haryana, Delhi, and Uttar Pradesh.
Heatwave Conditions are also prevailing in Gujarat, Madhya Pradesh, Bihar, Jharkhand, Odisha, West Bengal, and Uttarakhand.
What are the causes for warning in Tripura and Lakshadweep?
Answer:
The cause for warnings in Tripura is the presence of a cyclonic circulation over northeast Assam and its neighbouring areas leading to widespread rainfall accompanied by thunderstorms and gusty winds in Tripura.
The cause for warnings in Lakshadweep is a cyclonic circulation over south interior Tamil Nadu and an associated trough extending to Madhya Maharashtra which influenced weather patterns, resulting in heavy rainfall and thunderstorms in the Lakshadweep region.
Questions and activities
1. Match the instrument with the weather element it measures.
| Instrument used | Element of the Weather |
| (1) Hygrometer | (a) Precipitation |
| (2) Anemometer | (b) Atmospheric pressure |
| (3) Barometer | c) Wind direction and speed |
| (4) Thermometer | (d) Humidity |
| (5) Rain gauge | (e) Temperature |
Answer:
| Instrument used | Element of the Weather |
| (1) Hygrometer | (d) Humidity |
| (2) Anemometer | (c) Wind direction and speed |
| (3) Barometer | (b) Atmospheric pressure |
| (4) Thermometer | (e) Temperature |
| (5) Rain gauge | (a) Precipitation |
2. Jyotsna is deciding what clothes to pack for her school trip to Mumbai in June. She looks at the weather forecast, which predicts 29°C and 84% humidity. What would be your advice to her?
Answer:
The weather forecast for Mumbai in June is 29°C with 84% humidity, so it will feel hot and uncomfortably sticky.
I would advise her to carry light coloured cotton clothes which are loose and breathable because they would absorb the sweat and enable her to stay cool. She should pack a cap or vizor and sunglasses. A comfortable pair of sandals and a pair of flipflops for walking on the beach are essential. I would also advise her to carry an umbrella and a light raincoat because June marks the beginning of the monsoons in Mumbai. Of course, she must carry talcum powder and sunscreen along with essential toilet articles. It will be wise to pack some band aid along with her stock of regular medicines, insect repellents, and wet wipes.
3. Imagine that a small group of students is setting up a rain gauge.
Here are some options for the site.
1. The school vegetable garden.
2. The terrace of the school building.
3. Open ground with elevated platform.
4. Compound wall of school.
5. Verandah of the school laboratory.
Discuss in your group and finalise the site. Write down the reasons for your decision.
Answer:
The best site to set up the rain gauge is:
Option 3: Open ground with an elevated platform
Reasons for choice of this site:
1. There is open space all around which ensures that no trees, walls, or buildings would block the rain — this helps in collecting accurate rainfall data.
2. The elevated platform prevents water from splashing into the gauge from the ground if it rains very heavily and also the rain gauge is at a safe height above flood or puddle level.
3. There are no overhanging roofs (unlike on the terrace or veranda), from which extra water might drip into the gauge and give false readings.
4. Unlike the compound wall or garden, it’s less likely to be knocked over accidentally by students or animals.
This setup follows the standard guidelines used by weather stations for correct data.
4. Below is a chart taken from IMD, Jammu and Kashmir. Looking at the data available, write a short script to report the weather conditions in different parts of Jammu and Kashmir on the date shown. (Hint: Cover the temperature range, maximum and minimum temperatures, humidity, precipitation, etc.)
Daily Weather Parameters Jammu & Kashmir (EVENING)
DATE: 01-02-2024
| Station | Max Temperature Of date | Min Temperature Of date | From 0830 to 1730 hrs (mm/cm) | 24 hrs R/F Ending 0830 of date (mm/cm) | Relative humidity | |||||||
| ACT (0C) | NOR (0C) | DEP (0C) | ACT (0C) | NOR (0C) | DEP (0C) | R/F mm | S/N cm | R/F | S/N | 0830 (0/0) | 1730 (0/0) | |
| SRINAGAR | 6.5 | 8.9 | -2.4 | 0.2 | -0.7 | 0.9 | TR | 0.0 | 13.4 | 2.4 | 89 | 89 |
| QAZIGUND | 3.3 | 8.5 | -5.3 | -0.4 | -2.1 | 1.7 | 11.8 | 10.0 | 36.2 | 22.0 | 97 | 90 |
| PAHALGAM | 1.1 | 5.6 | -4.5 | -4.1 | -6.1 | 2.0 | 6.0 | 8.0 | 19.4 | 23.0 | 96 | 96 |
| KUPWARA | 5.1 | 8.5 | -3.4 | -0.7 | -2.3 | 1.6 | 0.5 | 0.0 | 21.9 | 10.0 | 97 | 94 |
| KUKERNAG | 2.6 | 6.6 | -4.0 | -1.4 | -2.4 | 1.0 | 12.0 | 8.0 | 35.2 | 30.0 | 96 | 97 |
| GULMARG | -2.6 | 1.4 | -4.0 | -7.6 | -7.6 | 0.0 | 8.2 | 6.35 | 35.2 | 35.0 | 76 | 100 |
| MUZAFARABAD | 8.5 | – | – | 5.6 | – | – | – | – | 25.8 | – | 93 | – |
Note: ACT means actual; NOR means normal; DEP is departure from normal; R/F is rainfall; S/N is snowfall; TR means trace amount.
Answer:
Weather Report: Jammu & Kashmir — 1st February 2024
Good evening! Here’s your weather update from across Jammu and Kashmir for the day.
- Srinagar experienced a maximum temperature of 6.5°C, which is 2.4°C below normal, and a minimum of 0.2°C. There was only a trace of rainfall, and humidity levels stayed high at 89% throughout the day.
- In Qazigund, the temperatures were lower, with a high of 3.3°C and a low of – 0.4°C. The area saw 11.8 mm of rainfall and 10 cm of snowfall during the day. Humidity ranged from 97% in the morning to 90% in the evening.
- Pahalgam was even colder, with a maximum of 1.1°C and a minimum of – 4.1°C. It received 6 mm of rain and 8 cm of snow, with very high humidity levels of 96% throughout the day.
- Moving to Kupwara, the temperature rose to 5.1°C, while the low touched – 0.7°C. It recorded 0.5 mm of rain, and humidity ranged from 97% to 94%.
- Kukernag saw a high of 2.6°C and a low of -1.4°C. It received 12 mm of rainfall and 8 cm of snow, with humidity peaking at 97% in the evening.
- Gulmarg was the coldest, with a maximum of -2.6°C and a low of -7.6°C. The ski resort saw 8.2 mm of rainfall and 6.35 cm of snow. Morning humidity was 76%, reaching 100% by evening, likely due to the snow.
- Finally, Muzaffarabad recorded the warmest high at 8.5°C and a minimum of 5.6°C, with 25.8 mm of rainfall and high humidity at 93%.
To summarize, most parts of Jammu and Kashmir saw sub-normal temperatures, moderate to heavy precipitation, and very high humidity, making it a cold and damp day across the union territory.
Stay warm and stay safe!
Hope you find our Solutions to NCERT Class 7 Social Science – Exploring Society: India and Beyond Chapter 2 ‘Understanding the Weather,’ helpful! If you need extra coaching, feel free to book a demo class here!